Summary
Background
In October 2021 the LGA conducted a survey of the climate change officers of all councils in England. The purposes of the survey were to assess what actions local authorities are taking to combat climate change, to assess their future needs for support in this area, and to evaluate the climate change sector support offer provided by the LGA. At total of 178 responded – a response rate of 53 per cent.
Key messages
- Respondents valued the climate change support provided by the LGA and indicated that a wide range of support in this area would be invaluable in the future.
- Most authorities measured their carbon emissions, regularly published carbon baselines and had established an official target for net zero or carbon neutrality.
- Most respondent authorities had agreed and up-to-date climate change strategies, executive climate change portfolio holders, and had climate related risks embedded into their corporate risk registers.
- Respondent councils faced a range of challenges to enacting climate change action and securing the required resources and staff capacity to do so, including overall amount of funding, short-term funding cycles, and lack of clarity on goals or instructions for implementing successful climate change related projects.
- A large majority of respondent councils had experienced one or more climate related incidents in the last five years, most frequently flooding but also including heatwaves, wildfires, storms and cold weather.
- Councils have implemented a wide range of measures to mitigate and adapt to changing climates and are adapting to changing circumstances to deliver further climate related action in future.
- Councils have established a wide range of partnerships with other local authorities and other organisations to combat climate change.
Key findings
- The LGA Green Webinars Series was the form of climate change support provided by the LGA which respondents were most familiar with.
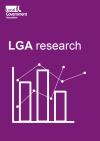
- Over seven tenths of local authorities surveyed were very or fairly satisfied with climate change support provided by the LGA.
- Nine tenths of respondents were very or fairly likely to recommend the LGA’s climate change support to other councils.
- Over nine tenths of respondents reported that the LGA’s climate change support has had a positive impact on their council to at least a small extent.
- The types of climate change support which respondents would most value from the LGA in future include educating the public and changing public behaviour and low carbon procurement in terms of areas of climate action, and climate change workshops and events in terms of support provided.
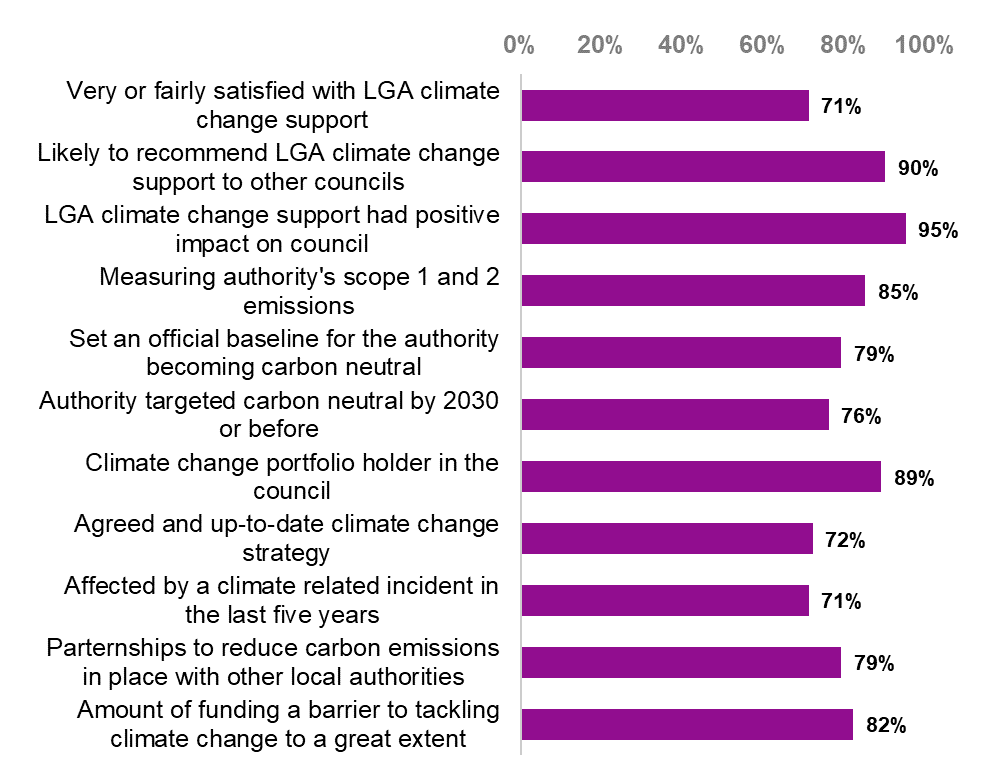
- The main challenge to securing the needed expertise and skills for climate change work was short-term funding necessitating 12-month contracts.
- More than eight out of ten respondents were already measuring their council’s scope 1 and 2 carbon emissions.
- Almost 80 per cent of respondent councils had set a target for becoming carbon neutral or net zero.
- Over three quarters of these targets had a targeted date of 2030 or before.
- Almost nine out of ten respondent councils had an executive council member with climate change issues specified in their portfolio.
- Almost three quarters of respondent councils had an agreed and up-to-date climate change strategy.
- The types of climate change mitigation project areas which respondent councils were most frequently involved in delivering were the installation of energy saving measures in the council’s own building stock, electric charging points and communications campaigns around mitigation.
- Over seven tenths of respondent authorities were affected by a climate related incident in the last five years, with flooding being the predominant type.
- The types of climate change adaptation project areas which respondent councils were most frequently involved in delivering were wildlife protection and biodiversity, sustainable urban drainage and flood awareness campaigns for residents.
- Almost eight out of ten respondents already had partnerships in place with other local authorities to reduce climate change.
- Over four fifths of respondents stated that the limited amount of available funding was a barrier to their authority tackling climate change to a great extent, and no respondents said that amount of funding was not a barrier at all.
Introduction
In October to December 2021 the Local Government Association (LGA) conducted a survey of climate change officers or equivalent across all councils in England. The purposes of the survey were to assess what actions local authorities are taking to combat climate change as well as their future needs for support in this area, and to evaluate the climate change sector support offer provided by the LGA. Topics included carbon emissions, carbon neutral target dates, the embedding of climate change action in corporate structures and strategic planning, and specific actions which authorities may have taken in relation to climate change mitigation or adaptation. (For the purpose of this exercise, climate change mitigation refers to efforts to reduce the scale of climate change, whilst climate change adaptation refers to efforts to reduce the negative impacts of climate change on communities.)
Methodology
In October 2021, the LGA’s Research and Information Team sent an online survey to contacts responsible for climate change across all councils in England, including district councils, county councils and single-tier councils. This survey was able to be completed by whichever officer in each authority was best placed to do so, even if this was not the officer originally contacted about the survey. Of the 333 councils in England, a total of 178 replied – a response rate of 53 per cent.
Whilst these results should strictly be taken as a snapshot of the views of this particular group of respondents, rather than representative of all climate change officers in local authorities, this level of response means that the results are likely to provide a good indication of the position of the sector more widely.
Table 1 shows the response rate by type of council. This demonstrates that the authority type with the highest response rate was unitary authorities, at 68 per cent, whilst metropolitan district councils had the lowest response rate, at 38 per cent.
| Type of authority | Total number | Number of responses |
Response rate % |
|---|---|---|---|
| District | 181 | 92 | 51% |
| County | 24 | 14 | 58% |
| London borough | 33 | 18 | 55% |
| Metropolitan district | 36 | 14 | 38% |
| Unitary | 59 | 40 | 68% |
Table 2 shows the response rate by region. This shows that the region with the highest response rate was the South West, at 72 per cent, whilst the one with the lowest response rate was the West Midlands, at 45 per cent.
|
Region |
Total number |
Number of responses |
Response rate (%) |
|---|---|---|---|
|
East of England |
50 |
27 |
54% |
|
East Midlands |
39 |
20 |
51% |
|
London |
33 |
18 |
55% |
|
North East |
12 |
6 |
50% |
|
North West |
41 |
22 |
54% |
|
South East |
70 |
33 |
47% |
|
South West |
33 |
24 |
72% |
|
West Midlands |
33 |
15 |
45% |
|
Yorkshire and Humber |
22 |
13 |
59% |
In addition, the following points should be noted about the research methodology:
- Please note that the bases from which percentages were calculated vary throughout the survey, as not all respondents were shown all questions, and all questions were optional, meaning that some respondents chose not to answer them.
- Throughout the report percentages in figures and tables may add to more than 100 per cent due to rounding. Percentages are rounded to the nearest whole per cent, and large numerical figures are rounded to the nearest thousand.
Climate Change Survey 2021
This section contains analysis of the full results from the survey.
Awareness of LGA climate change support
Respondents were asked the extent to which they were aware of various aspects of the LGA’s Climate Change Sector Support Programme. The results for this question are shown in Table 3. Respondents showed varying levels of knowledge of each of the forms of support, with the most widely known including the LGA Green Webinars Series (93 per cent to at least a small extent), the LGA and Local Partnerships Greenhouse Gas Accounting Tool (89 per cent), and the LGA Climate Change E-bulletin (84 per cent).
The least known forms of support include the Centre for Governance and Scrutiny Guidance 10 questions to scrutinise climate action (with 60 per cent having no awareness of it at all), the Local Action for Our Environment podcast (62 per cent), and the reduced rate pricing offered by Aurora Energy Research (75 per cent).
|
To at least a small extent |
To a great extent |
To a moderate extent |
To a small extent |
Not at all |
|
|---|---|---|---|---|---|
|
LGA Green Webinars Series e.g. biodiversity, energy, community engagement and LGA conference |
93% |
36% |
33% |
24% |
7% |
|
LGA and Local Partnerships Greenhouse Gas Accounting tool |
89% |
38% |
33% |
18% |
12% |
|
LGA Climate Change E-bulletin |
84% |
42% |
28% |
14% |
16% |
|
The Climate Emergency Knowledge Hub |
83% |
24% |
32% |
27% |
18% |
|
Climate Change Case Studies including the Pass the Planet campaign |
79% |
19% |
31% |
29% |
20% |
|
The Net Zero Innovation Programme |
78% |
14% |
36% |
28% |
22% |
|
The LGA Climate Change Webpage Support Hub |
78% |
12% |
35% |
31% |
21% |
|
The Local Pathway to Net Zero Guidance for Councillors |
71% |
14% |
25% |
32% |
29% |
|
LGA Leadership Essentials: Climate Emergency |
64% |
8% |
28% |
28% |
36% |
|
LGA Climate Change Communications Guide |
62% |
5% |
29% |
28% |
37% |
|
LGA Behaviour Change and the Environment Guide |
55% |
5% |
24% |
26% |
45% |
|
The Design in the Public Sector Programme |
53% |
5% |
18% |
30% |
47% |
|
LGA Biodiversity e-learning |
49% |
5% |
15% |
29% |
50% |
|
The Leading and Learning Green Jobs Programme (action learning sets) |
43% |
3% |
14% |
26% |
57% |
|
The Centre for Governance and Scrutiny Guidance 10 questions to scrutinise climate action |
40% |
5% |
15% |
20% |
60% |
|
Local Action for Our Environment podcast |
38% |
4% |
10% |
24% |
62% |
|
Other (please specify) |
33% |
5% |
14% |
14% |
68% |
|
Access to reduced rate local authority pricing for Aurora Energy Research market forecasts through Local Partnerships |
24% |
1% |
7% |
16% |
75% |
Satisfaction with LGA climate change support
Respondents were asked how satisfied or dissatisfied they were overall with the LGA Climate Change Sector Support Programme. The results for this question are displayed in Table 4. In total, 71 per cent of respondents were very or fairly satisfied with the climate change support offered by the LGA, including 16 per cent who were very satisfied and a further 55 per cent who were fairly satisfied. Around 29 per cent of respondents were neither satisfied nor dissatisfied with this aspect of the LGA’s support offer, whilst one per cent of respondents were fairly dissatisfied and no respondents were very dissatisfied.
|
Per cent |
|
|---|---|
|
Very or fairly satisfied |
71% |
|
Very satisfied |
16% |
|
Fairly satisfied |
55% |
|
Neither satisfied nor dissatisfied |
29% |
|
Fairly dissatisfied |
1% |
|
Very dissatisfied |
0% |
Base: all respondents who answered this question (154 respondents).
Respondents were asked how likely they would be to recommend the LGA Climate Change Sector Support Programme to other councils. The results for this question are shown in Table 5. Ninety per cent of respondents said they were very or fairly likely to recommend the LGA’s climate change support in this way, consisting of 29 per cent of respondents who were very likely to recommend the LGA and a further 61 per cent who were fairly likely to recommend the programme. Around ten per cent were not likely to recommend the LGA Climate Change Sector Support Programme, including one per cent who were not at all likely and a further nine per cent who were not very likely to recommend the programme.
|
Per cent |
|
|---|---|
|
Very or fairly likely |
90% |
|
Very likely |
29% |
|
Fairly likely |
61% |
|
Not very likely |
9% |
|
Not at all likely |
1% |
Base: all respondents who answered this question (130 respondents).
Respondents were asked to what extent the LGA Climate Change Sector Support Programme has had a positive impact on their council. The results to this question are shown in Table 6. Around eight per cent of respondents indicated that this support has had a positive impact to a great extent, whilst 43 per cent indicated that this was true to a moderate extent and 44 per cent to a small extent. A further five per cent indicated that this was not the case at all regarding their own local authority.
|
Per cent |
|
|---|---|
|
To at least a small extent |
95% |
|
To a great extent |
8% |
|
To a moderate extent |
43% |
|
To a small extent |
44% |
|
Not at all |
5% |
Base: all respondents who answered the question (140 respondents)
Future climate change support needs
Respondents were asked in what areas, if any, they could benefit from expertise, skills and support delivered by the LGA in relation to climate change. This included two separate though related lists of areas of support:
- areas of climate action for the support to focus on
- types of support delivered.
Tables 7 and 8 show the results for this question for areas of climate action and types of LGA support respectively. These results show that the areas of climate action action which the respondents would most value in future are educating the public or changing public behaviour, mentioned by 81 per cent of respondents, low carbon procurement (selected by 75 per cent), embedding carbon considerations into decision-making (selected by 74 per cent), and green economic planning (selected by 73 per cent).
|
Per cent |
|
|---|---|
|
Educating the public/changing public behaviour |
81% |
|
Low carbon procurement |
75% |
|
Embedding carbon considerations into decision-making |
74% |
|
Green economic planning |
73% |
|
Adaptation to changing climates |
65% |
|
Carbon budgeting |
64% |
|
Energy support, including renewable energy and local area energy planning |
62% |
|
Communications on climate change |
60% |
|
Carbon auditing |
52% |
|
Sustainable urban/town/rural planning |
51% |
|
Electric vehicle charging infrastructure |
50% |
|
Energy efficient building measures |
49% |
|
Climate justice |
45% |
|
Sustainable transport planning |
40% |
|
Biodiversity |
40% |
|
Other area(s) of climate action (please specify) |
10% |
The results in Table 8 show that the types of LGA support most commonly selected to benefit authorities were climate change workshops and events (selected by 82 per cent of respondents), sector specific guidance on good practice for scope 3 carbon emissions (selected by 76 per cent), and good practice and case studies (selected by 75 per cent).
|
Per cent |
|
|---|---|
|
Climate change workshops and events |
82% |
|
Sector specific good practice guidance on scope 3 emissions |
76% |
|
Good practice and case studies |
75% |
|
Bespoke council peer support |
48% |
|
Peer benchmarking |
45% |
|
Leadership programmes |
42% |
|
Action learning sets |
40% |
|
Podcasts |
20% |
|
Other expertise of method(s) of support (please specify below) |
8% |
Challenges to securing climate expertise
Respondents were asked to select the main challenges to securing the needed expertise and skills in climate change work. Table 9 and Figure 2 show the results for this question: the most frequently cited challenges were short-term funding necessitating 12-month contracts (selected by 49 per cent of respondents), difficulty upskilling current staff capacity (selected by 44 per cent), uncertainty as to which areas needing further development should be prioritised (selected by 38 per cent), and difficulty finding candidates with the required skills (selected by 37 per cent). Thirty-four respondents provided other main challenges to securing the needed expertise and skills in climate change work. A condensed list of these suggested areas is as follows:
- difficulties recruiting suitable candidates
- difficulty finding qualified fitters for green energy solutions such as air source heat pumps
- implementation of green education, curriculum to improve people skill and knowledge
- it is everyone's role in the council, so everyone needs a base level of understanding and commitment
- lack of capacity and dedication of those who have a larger influence in the organisation
- lack of funding
- lack of headspace in existing roles
- lack of staff capacity
- mainstreaming sustainability into all local government/public sector professions/cllrs
- need for clear pathways for different professions beyond initial 'carbon literacy' competence.
- our team is entirely funded by external funding so we have to focus on externally funded projects rather than the core response to climate change.
- recruitment freeze
- there is no dedicated member of staff to undertake climate change works
- this needs political will to create this post.
|
Per cent |
|
|---|---|
|
Short-term funding necessitating 12-month contracts |
49% |
|
Difficulty upskilling current staff capacity |
44% |
|
Uncertainty as to which areas in need of further development should be prioritised |
38% |
|
Difficulty finding candidates with the required skills |
37% |
|
Uncertainty as to what expertise and skills should be prioritised |
31% |
|
Inability to compete with other employers in terms of salaries |
28% |
|
Other (please specify below) |
19% |
Measurement of carbon emissions
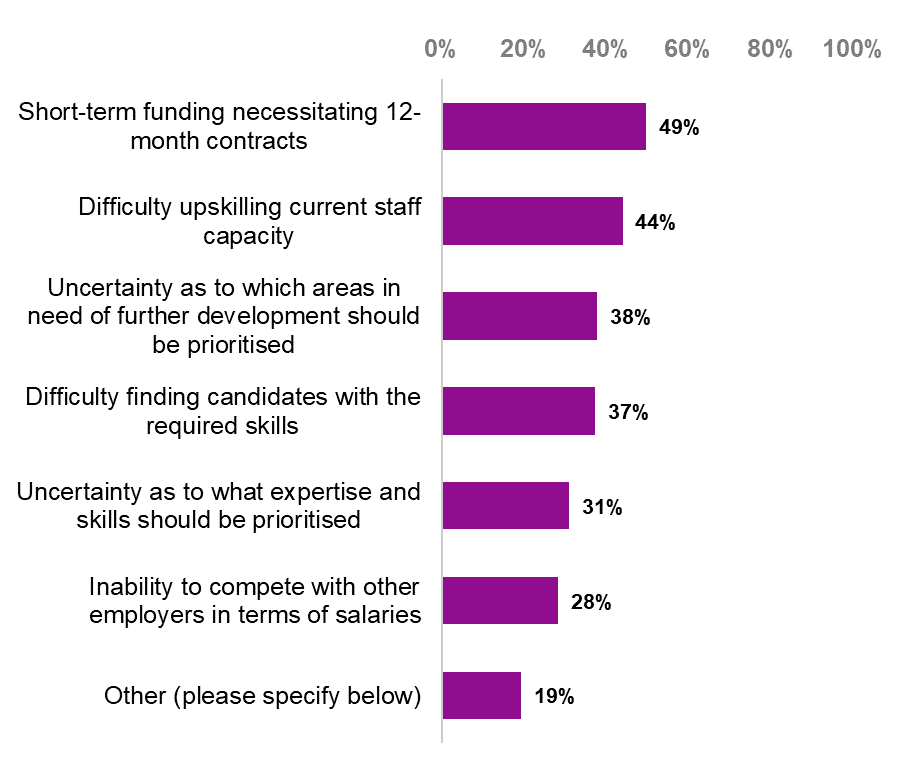
Respondents were asked both whether their council already measured or was planning to measure their own carbon emissions as a local authority, and those of their local area. A distinction was made between scope 1 and 2 emissions (all direct emissions and indirect emissions from purchased electricity respectively) and scope 3 emissions (all other indirect emissions, for example those resulting from business travel, procurement, waste and water). For more information see https://compareyourfootprint.com/difference-scope-1-2-3-emissions.
Table 10 and Figure 3 show the results of this question. All respondents were measuring or developing plans to measure their own local authority’s scope 1 and 2 emissions, with 85 per cent already measuring and the remaining 14 per cent planning to measure these emissions. Around 48 per cent were already measuring their authority’s scope 3 emissions, whilst 41 per cent were planning to measure and nine per cent had no current plans to measure these emissions.
Fifty per cent of respondents were already measuring the scope 1 and 2 emissions of their authority’s local area, with 24 per cent planning to measure and 22 per cent with no plans to measure these emissions. Finally, 15 per cent already measured their area’s scope 3 emissions, whereas 32 per cent were developing plans to measure them and 46 per cent had no current plans to measure them.
| Authority | Local area | |||
|---|---|---|---|---|
|
Scope 1 and 2 (per cent) |
Scope 3 (per cent) |
Scope 1 and 2 (per cent) |
Scope 3 (per cent) |
|
|
Yes, already measured |
85% |
48% |
50% |
15% |
|
No, but plans to measure in development |
14% |
41% |
24% |
32% |
|
No, and no current plans to develop measures yet |
0% |
9% |
22% |
46% |
|
Don’t know |
0% |
0% |
0% |
0% |
|
Base (all respondents who answered the question) |
177 |
174 |
171 |
170 |
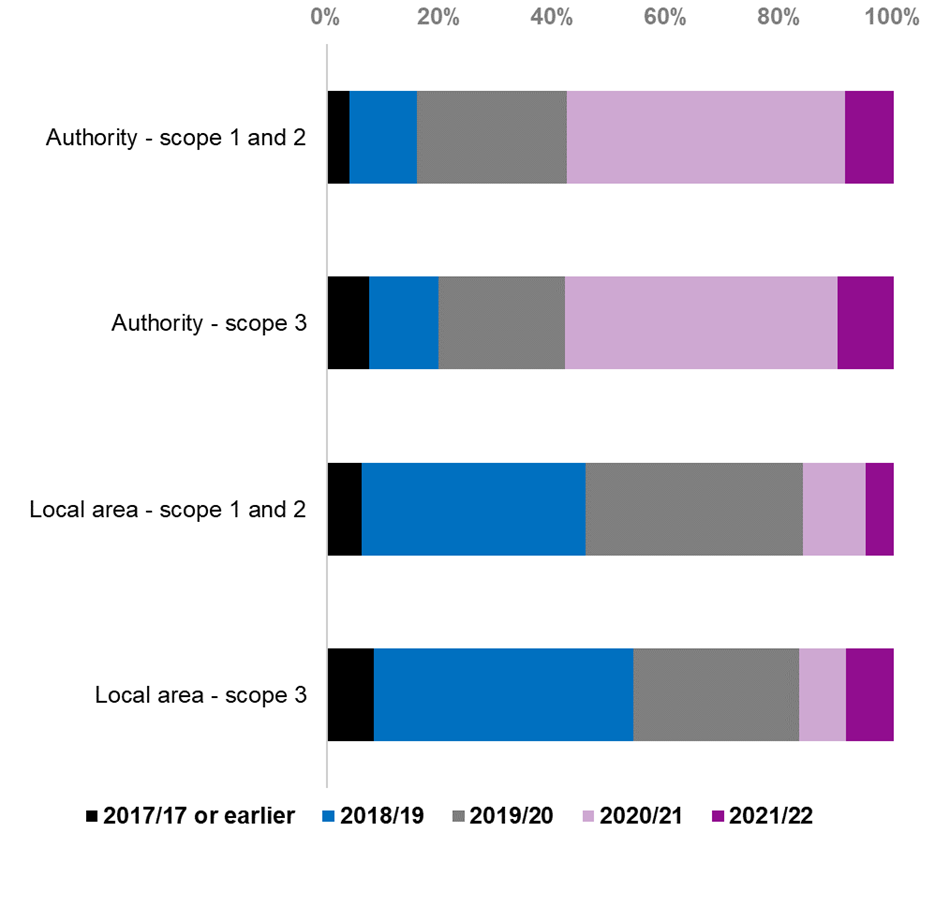
Respondents who already measured scope 1 and 2 and scope 3 emissions were asked to report the latest financial year in which these emissions were measured. These results are shown in Table 11 and Figure 4: almost half (49 per cent) of respondents who were measuring scope 1 and 2 emissions for their local authority had last measured these in 2020/21, with a further nine per cent having last measured these emissions in 2021/22. Around 26 per cent last measured their authority’s scope 1 and 2 emissions in 2019/20, 12 per cent in 2018/19, and four per cent in 2017/18 or earlier. A very similar distribution existed for local authority scope 3 emissions.
Local area emissions tended to have last been measured less recently, with almost 50 per cent last measured in 2018/19 and around 20 to 40 per cent last measured in 2019/20.
| Authority | Local area | |||
|---|---|---|---|---|
|
Scope 1 and 2 (per cent) |
Scope 3 (per cent) |
Scope 1 and 2 (per cent) |
Scope 3 (per cent) |
|
|
2017/18 or earlier |
4% |
7% |
6% |
8% |
|
2018/19 |
12% |
12% |
40% |
46% |
|
2019/20 |
26% |
22% |
38% |
29% |
|
2020/21 |
49% |
48% |
11% |
8% |
|
2021/22 |
9% |
10% |
5% |
8% |
|
Base (all respondents who answered the question) |
151 |
81 |
81 |
24 |
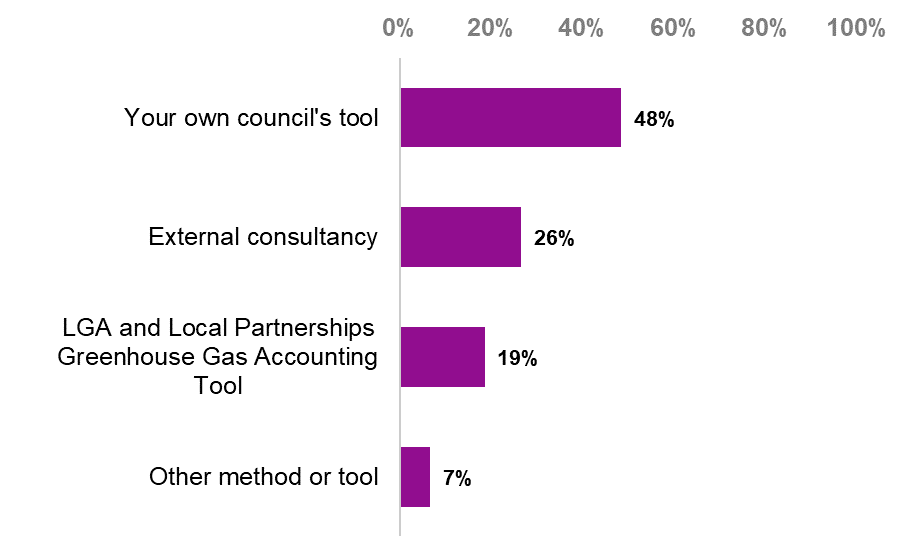
Respondents who had already measured their local authority’s carbon emissions were asked which method or tool they used to arrive at these emissions. Table 12 and Figure 5 show the results for this question: 48 per cent of respondents who are already measuring emissions for their authority used their own council’s tool, whilst 26 per cent used external consultancy and 19 per cent used the LGA and Local Partnerships Greenhouse Gas Accounting Tool.
|
Per cent |
|
|---|---|
|
Your own council’s tool |
48% |
|
External consultancy |
26% |
|
LGA and Local Partnerships Greenhouse Gas Accounting Tool |
19% |
|
Other method or tool |
7% |
Base: all respondents who answered this question (151 respondents).
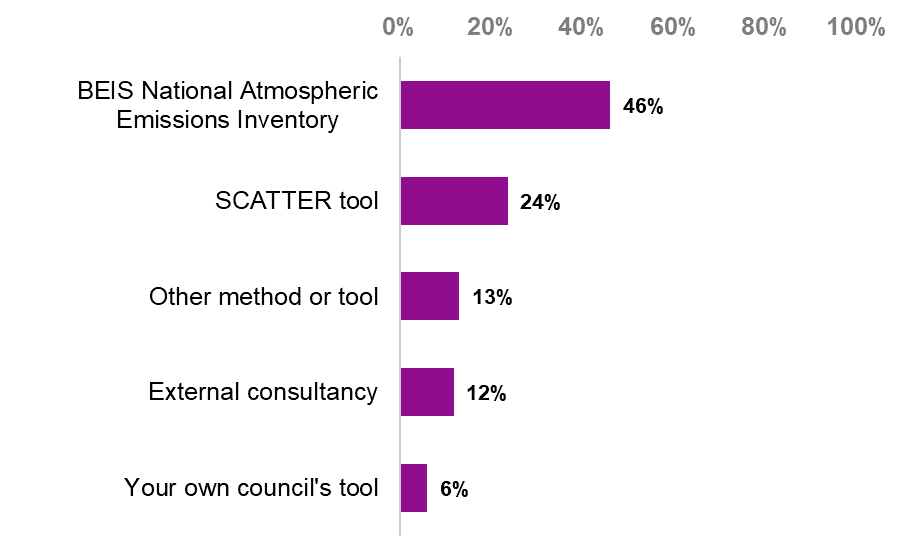
Respondents who had already measured their area’s carbon emissions were asked which method or tool they used to arrive at these emissions. Table 13 and Figure 6 show the results for this question: 46 per cent of respondents measured their area’s carbon emissions using the Department for Business, Energy and Industrial Strategy (BEIS) National Atmospheric Emissions Inventory, whereas 24 per cent used the Setting City Area Targets and Trajectories for Emissions Reduction (SCATTER) tool, 12 per cent used external consultancy, and 6 per cent used their own council’s tool. Thirteen per cent of respondents used another method or tool to estimate their area’s carbon emissions.
|
Per cent |
|
|---|---|
|
BEIS National Atmospheric Emissions Inventory |
46% |
|
SCATTER tool |
24% |
|
Other method or tool |
13% |
|
External consultancy |
12% |
|
Your own council’s tool |
6% |
Base: all respondents who answered this question (85 respondents).
Respondents who indicated that their authority already measures emissions of at least one of the four types was asked to provide the latest emissions measurements, measured in tonnes of carbon dioxide per year, for any of the four types which were available. It was not possible to produce reliable overall emissions estimates based on these figures, due to a combination of factors: a low percentage of respondents providing numerical estimates; a lack of representation among all regions and authority types; extremely low numbers of estimates for scope 3 emissions provided; and considerable variation in the estimates, suggesting a combination of measurement error and incompatible measurement methodologies.
Carbon baselines and targets for carbon neutrality
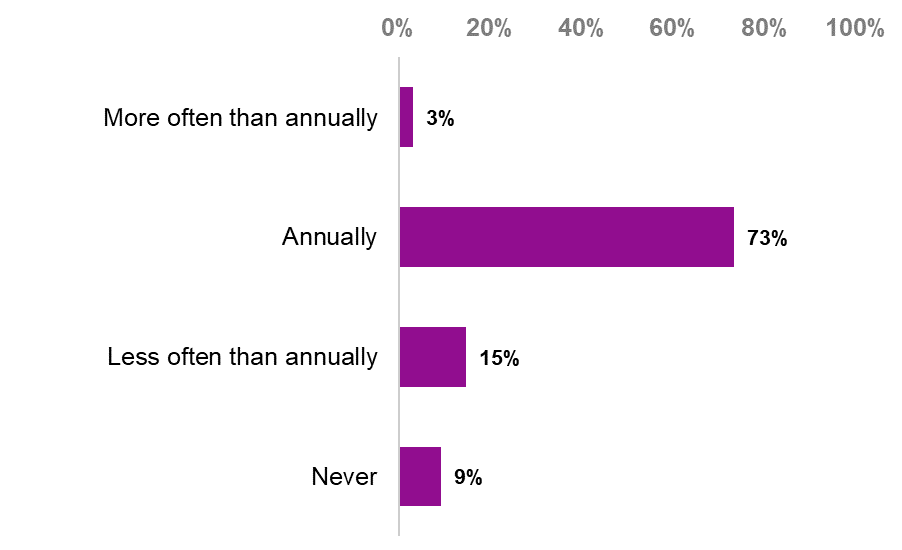
Respondents were asked how often their authority publishes its carbon baseline. Table 14 and Figure 7 show the results for this question: three quarters of responding authorities published their carbon baselines on an annual basis (73 per cent of respondents), with 15 per cent publishing their baseline less often than annually, three per cent publishing their baseline more often than annually, and nine per cent never published their baseline.
|
Per cent |
|
|---|---|
|
More often than annually |
3% |
|
Annually |
73% |
|
Less often than annually |
15% |
|
Never |
9% |
Base: all respondents who answered this question (164 respondents).
Respondents were asked whether their authority has set an official target for becoming carbon neutral for the authority itself, the area as a whole, or both. Table 15 summarises the results of this question, showing that almost 80 per cent of the respondents who answered the question indicated that their authority has set an official target for its own carbon neutrality, and 55 per cent indicated that their authority has set an official target for its area’s carbon neutrality. Around 41 per cent of respondents indicated that their council has set official targets for both of these, hence why the total of these percentages exceeds 100.
|
Per cent |
|
|---|---|
|
Yes, for the authority itself |
79% |
|
Yes, for the area as a whole |
55% |
|
No |
7% |
|
Don’t know |
0% |
Base: all respondents who answered this question (177 respondents). As the question allowed respondents to select all responses that apply, percentages will not necessarily sum to 100.
Respondents who indicated that they have set an official target for becoming carbon neutral were asked to specify the scope of these targets- that is, whether or not they contain scope 3 emissions, as explained above. Those who indicated that their authority has set carbon neutral targets for both itself and its area were asked to answer this question twice, once for each target.
Table 16 shows the results for this question for both authority and area targets. Around 43 per cent of authority targets included scope 3 emissions, whilst 38 per cent included scope 1 and 2 emissions only. Conversely, 44 per cent of local area targets did not include scope 3 emissions, whilst 34 per cent of these targets included scope 3 emissions. In general, respondents selected the “don’t know” option more often when describing the target for their authority’s local area than when describing their authority’s target for itself.
The “other” emissions scopes specified by respondents for their authority’s target generally involved incorporation of a limited range of scope 3 emissions types, without including all forms of scope 3 emissions on grounds of feasibility of data collection and focusing on forms of emissions within the authority’s direct control. The exact types of emissions excluded and included differed markedly between respondents.
Broadly the same is true of those answering “other” regarding the target for their local area, although a significant minority of these respondents explained that they had not yet decided on the precise scope of their emissions target, or that their target was specified in a way that could not be directly linked to or defined in terms of the scope boundaries. Several respondents mentioned that their targets were based on definitions applied by external agencies, most notably the Department for Business, Energy and Industrial Strategy (BEIS) data release.
|
|
Authority’s target (per cent) |
Area’s target (per cent) |
|---|---|---|
|
Includes scope 1, 2 and 3 emissions |
43% |
34% |
|
Scope 1 and 2 emissions only |
38% |
44% |
|
Other (please specify below) |
17% |
15% |
|
Don’t know |
2% |
7% |
|
Base (all respondents who answered the question) |
138 |
94 |
Respondents who indicated that their authority has set an official carbon neutral target for itself, its area, or both were asked to specify the date or dates by which the authority and/or the area aim to become carbon neutral. As Table 17 shows, the most common single year specified as a target was 2030, alone accounting for 70 per cent of authorities’ targets for themselves. Targets specified for whole local areas tended to be distributed later than targets for local authorities themselves, with an almost even division between targets set for 2030 and targets set for after that year. For both authority and area targets, only a small minority of respondents provided carbon neutral target dates before 2030.
| Authority’s target (per cent) | Area’s target (per cent) | |
|---|---|---|
|
Before 2030 |
6% |
1% |
|
2030 |
70% |
49% |
|
After 2030 |
24% |
50% |
|
Base (all respondents who answered the question) |
136 |
98 |
It should be noted that a significant minority of respondents noted that their target was a net zero target rather than a carbon neutral target. Carbon neutrality is achieved by balancing carbon emissions with offsetting activities, even if the emissions themselves have not been reduced. Net zero, by contrast, involves reducing emissions as far as possible and then offsetting those emissions which are unavoidable.
Climate change portfolio holders
Respondents were asked whether there is an executive council member of their authority whose portfolio specifies a lead role on climate change. As Table 18 shows, around 89 per cent of respondents indicated that their council has a portfolio holder for climate change within its executive.
|
Per cent |
|
|---|---|
|
Yes |
89% |
|
No |
8% |
|
Don’t know |
3% |
Base: all respondents who answered the question (177 respondents).
Climate change strategy
Respondents were asked whether their authority has an agreed and up to date climate change strategy. Around 72 per cent of respondents indicated that they have a climate strategy and that it is already being delivered. A further 5 per cent reported having a completed strategy that is not yet being delivered, and a further 12 per cent said that a climate strategy is being developed but is not yet completed. Together, these responses add up to 89 per cent of respondents who answered this question. The results for this question are shown in Table 19.
|
Per cent |
|
|---|---|
|
Yes, already being delivered |
72% |
|
Yes, completed but not yet being delivered |
5% |
|
No, but currently in development |
12% |
|
No, but planning to produce one |
10% |
|
No, and no current plans to produce one yet |
1% |
|
Don’t know |
0% |
Base: all respondents who answered the question (177 respondents).
All respondents other than those without a strategy and with no plans to produce one were asked whether their strategy covers or will cover climate change mitigation, climate change adaptation, or both. As Table 20 shows, around 72 per cent of strategies included both mitigation and adaptation, with 23 per cent covering mitigation only and no strategies covered adaptation only. Around five per cent of respondents to this question did not know if mitigation, adaptation or both were or would be covered.
|
Per cent |
|
|---|---|
|
Both mitigation and adaptation |
72% |
|
Mitigation only |
23% |
|
Adaptation only |
0% |
|
Don't know |
5% |
Base: all respondents who answered the question (174 respondents).
All respondents other than those without a strategy and with no plans to produce one were asked whether specific financial resources have already been secured to implement the strategy. As Table 21 shows, although only five per cent of respondents indicated that their council had already secured enough financial resources to implement their entire strategy, 80 per cent indicated that they had secured some of the required financial resources. A further 15 per cent indicated that they had not yet secured any of the required financial resources to implement their strategy.
|
Per cent |
|
|---|---|
|
Yes, all of the resources required to implement it |
5% |
|
Yes, some of the resources required to implement it |
80% |
|
No |
15% |
|
Don’t know |
0% |
Base: all respondents who answered this question (172 respondents).
All respondents who indicated that their authority has already secured some or all of the financial resources required to implement their strategy were asked to specify when the funding already secured will first be provided. This question was split between mitigation and adaptation activities in case any difference in the provision of funding existed between them. As Table 22 shows, 79 per cent of funding secured for mitigation activities was already in place as of the financial year 2021/22. This figure was considerably lower among adaptation activities, at 46 per cent. Only small proportions of the respondents indicated that the funding already secured would first be provided in 2022/23 or beyond, with the remainder replying that they don’t know when the funding will first be provided. The proportion saying that they don’t know was considerably larger concerning adaptation activities (48 per cent) than that of mitigation activities (15 per cent).
|
|
Mitigation (per cent) |
Adaptation (per cent) |
|---|---|---|
|
Already in place as of 2021/22 |
79% |
46% |
|
2022/23 |
4% |
2% |
|
Beyond 2022/23 |
2% |
5% |
|
Don’t know |
15% |
48% |
|
Base (all respondents who answered the question) |
124 |
107 |
Respondents who indicated that they had already secured the funding to implement their strategy were asked to estimate the approximate amount of funding already secured within a range of time periods. Only three respondents provided an answer to this question, meaning that it was not possible to calculate reliable overall estimates for all authorities.
All respondents were asked to estimate the approximate amount of additional funding, not including any already secured, that would be required to implement climate change measures over a range of time periods. These time periods were cumulative, with, for example, the funding required for the next five financial years also included within the funding required for the next ten financial years. Between 13 and 33 respondents provided responses to this question, varying depending on the time period in question. (Some respondents provided data for an earlier time period but not a later one, for example, the next five financial years but not the next ten financial years. Because subsequent figures are cumulative and include all previous figures, it was possible to assume that these later figures would be at least as great as the figure immediately before them, and so the estimate for the previous period was copied into the estimate for the subsequent period. The fact that, in these cases, there was no increase in the total amount of additional funding required, which in practice is unlikely, means that these estimates are intrinsically conservative in nature.)
This small number of responses means that the overall estimates below must be treated with caution, and also means that attempting to produce estimates for specific regions or authority types would be inadvisable as they would not be reliable. To prevent very high values from skewing the overall estimates, the median figure among responding authorities has been used instead of the mean (For more information on this, see https://statistics.laerd.com/statistical-guides/measures-central-tendency-mean-mode-median.php.) The estimated totals were calculated simply by multiplying these median figures by 333, the current number of councils in England.
Table 23 shows the England estimates for the additional funding required in the next five and ten financial years. Respondents were also asked to provide estimates for the next fifteen and twenty financial years, but as only a small number of respondents provided these figures overall estimates have not been provided. As this shows, the estimated additional funding, not including funding already secured, required by local authorities to deliver their climate change strategies in the next five financial years was around £3.5 billion, and the figure for the next ten financial years was around £6.7 billion.
Communications plan for climate change
All respondents were asked whether their authority has a communications plan for climate change. As Table 24 shows, around 68 per cent of respondents indicated that their authority has a communications plan that is either completed or in development, including 42 per cent who indicated that their communications plan is being delivered and a further five per cent who indicated that their communications plan is complete, although not yet being delivered. Around 26 per cent indicated that their authority was planning to produce a communications plan for climate change, though such a plan was not yet in development. Only five per cent of respondents indicated that their authority has no communications plan for climate change and no plans to produce one yet.
|
Per cent |
|
|---|---|
|
Yes, being delivered |
42% |
|
Yes, completed but not yet being delivered |
5% |
|
No, but in development |
21% |
|
No, but planning to produce one |
26% |
|
No, and no current plans to produce one yet |
5% |
|
Don’t know |
1% |
Base: all respondents who answered the question (173 respondents).
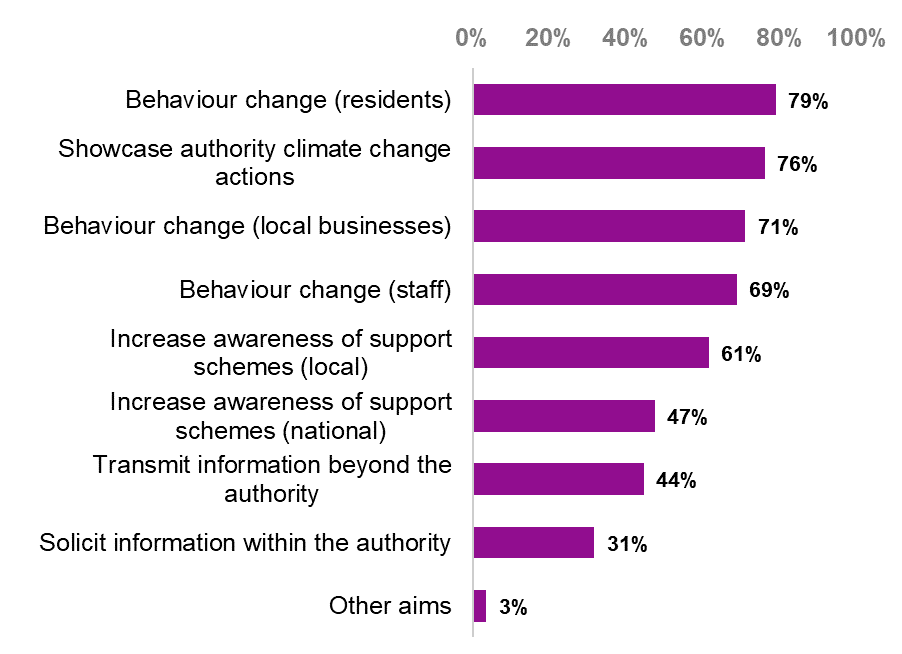
Respondents were asked to specify the principal aims of their authority’s communications plan. As Table 25 and Figure 8 show, the chief aims selected were influencing behaviour change among residents (79 per cent of respondents), showcasing the authority’s climate change actions (76 per cent), influencing behaviour change among local businesses (71 per cent) and influencing behaviour change among staff (69 per cent).
|
Per cent |
|
|---|---|
|
To influence behaviour change among residents |
79% |
|
To showcase the authority's climate change actions |
76% |
|
To influence behaviour change among local businesses |
71% |
|
To influence behaviour change among staff |
69% |
|
To increase awareness of local climate change support schemes |
61% |
|
To increase awareness of national climate change support schemes |
47% |
|
To transmit information on climate change beyond the authority |
44% |
|
To solicit information on climate change within the authority |
31% |
|
Other aims |
3% |
Base: all respondents (178 respondents).
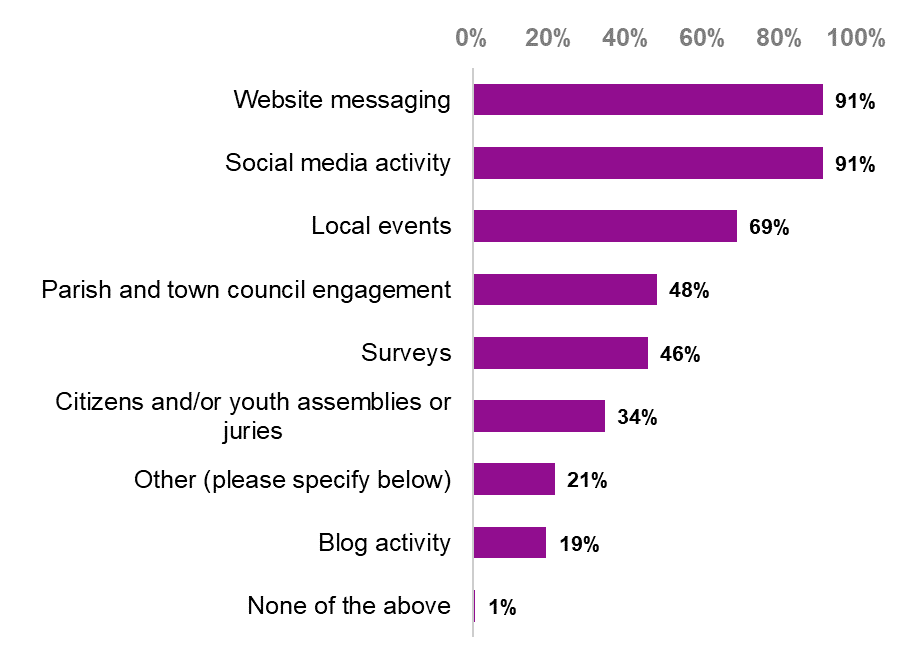
Respondents were asked to indicate which of a range of communications activities their authority was undertaking or planning to undertake around climate change. Respondents were able to select all activities that applied to them. As Table 26 and Figure 9 show, the most frequently cited communications activities were website messaging and social media activity (both 91 per cent), local events (69 per cent), parish and town council engagement (48 per cent) and surveys (46 per cent).
|
Per cent |
|
|---|---|
|
Website messaging |
91% |
|
Social media activity |
91% |
|
Local events |
69% |
|
Parish and town council engagement |
48% |
|
Surveys |
46% |
|
Citizens and/or youth assemblies or juries |
34% |
|
Other (please specify below) |
21% |
|
Blog activity |
19% |
|
None of the above |
1% |
Base: all respondents (178 respondents).
Of the 38 respondents who selected the “other” option, 36 provided textual comments to clarify the nature of these activities. The activities which they mentioned can be grouped into the following categories, with some individual comments accounting for more than one category:
- area wide 'hub' of different partners
- awards
- behaviour change app
- climate awareness store
- community climate champions
- community engagement via online platform (Engagement HQ)
- email bulletin
- engagement with local community groups
- events for stakeholders
- films and images, culture, exhibitions and arts
- local 'climate action network'
- local press
- neighbourhood Fora
- online webinars
- pledge campaign
- press releases
- promoting case studies
- schools/colleges engagement
- staff intranet information.
Climate change mitigation project areas delivered
Respondents were asked to indicate which of a series of climate change mitigation project areas their authority had delivered in the last ten years, was delivering currently, or planned to deliver in future. Respondents could select any answer that applied, including multiple responses for each mitigation project area (for example, if they had delivered a particular project area in the past and planned to do so again in future).
Table 27 shows the responses as percentages of the total number of respondents to this question. It shows that the most frequently selected mitigation project areas overall included installing energy saving measures in the council’s own building stock, electric charging points, communications campaigns around climate change and small-scale solar photovoltaic installations. Project areas which were relatively frequently delivered in the past, but which were not planned very frequently in future, include combined heat and power (excluding waste schemes), solar water heating and energy from biomass. Conversely, projects which had not been delivered frequently in the past, but which were increasingly planned looking forward, included large-scale photovoltaic installations, ground source heat pumps, divestment from companies posing an environmental risk, and introducing hybrid or electric buses on bus routes. Project areas which have historically had low uptake, and which were not frequently planned for the future, included biofuels or biogas and wind energy.
|
|
Have previously delivered in the last ten years |
Delivering currently |
Plan to deliver in the next two years |
Plan to deliver in the longer term |
|---|---|---|---|---|
|
Installation of energy saving measures in the council's own building stock |
61% |
60% |
43% |
26% |
|
Electric charging points |
51% |
60% |
45% |
27% |
|
Communications campaigns around mitigation |
34% |
53% |
43% |
23% |
|
Small-scale solar photovoltaic installations (less than 1MW) |
51% |
40% |
34% |
25% |
|
Installation of energy saving measures in community buildings |
35% |
37% |
32% |
22% |
|
Other mitigation project areas |
21% |
41% |
36% |
20% |
|
Large-scale solar photovoltaic installations (1MW or greater) |
13% |
14% |
17% |
36% |
|
Ground source heat pumps |
8% |
14% |
20% |
27% |
|
Divestment from companies posing an environmental risk in your authority’s assets and pension scheme |
8% |
13% |
16% |
21% |
|
Energy from waste |
18% |
18% |
5% |
9% |
|
Combined heat and power (excluding waste schemes) |
25% |
12% |
4% |
9% |
|
Increasing bus routes |
9% |
11% |
16% |
11% |
|
Solar water heating |
21% |
5% |
7% |
12% |
|
Introducing hybrid or electric buses on bus routes |
5% |
7% |
13% |
14% |
|
Energy from biomass |
22% |
5% |
2% |
8% |
|
Biofuels or biogas |
7% |
4% |
8% |
10% |
|
Wind energy |
7% |
2% |
1% |
8% |
Base: all respondents who answered this question (169 respondents).
The other mitigation project areas specified by the respondents were grouped into the following broad categories, some of which were variations on the options provided in the questionnaire:
- home or community grants or renewability schemes (14 respondents);
- replacing council vehicles with more sustainable alternatives (12 respondents);
- Air source heat pumps (10 respondents);
- Tree planting as a method of mitigating climate change (10 respondents);
- Changes to strategies, plans and policies (seven respondents);
- Carbon literacy training and education (six respondents);
- District heat networks (six respondents);
- Encouraging walking, cycling and exercise (four respondents);
- Business engagement and support (three respondents);
- Encouraging recycling and reducing non-recyclable materials (three respondents);
- Hydroelectric power (three respondents);
- Peatland restoration (three respondents);
- Battery storage (two respondents);
- Changes to procurement or contracts to improve renewability (two respondents);
- Cycling infrastructure (two respondents);
- Decarbonisation support programmes (two respondents);
- Hydrogen-powered vehicles (two respondents);
- Mine water heating (two respondents);
- Retrofitting street lights with more efficient alternatives (two respondents);
- A collection of other project areas mentioned by one respondent each:
- Biodiversity-related mitigation projects
- Clean air or low emissions zones
- Climate change mitigation in agriculture
- Heat recovery systems
- Research initiatives
- Utilising waste heat
- Water source heat pumps
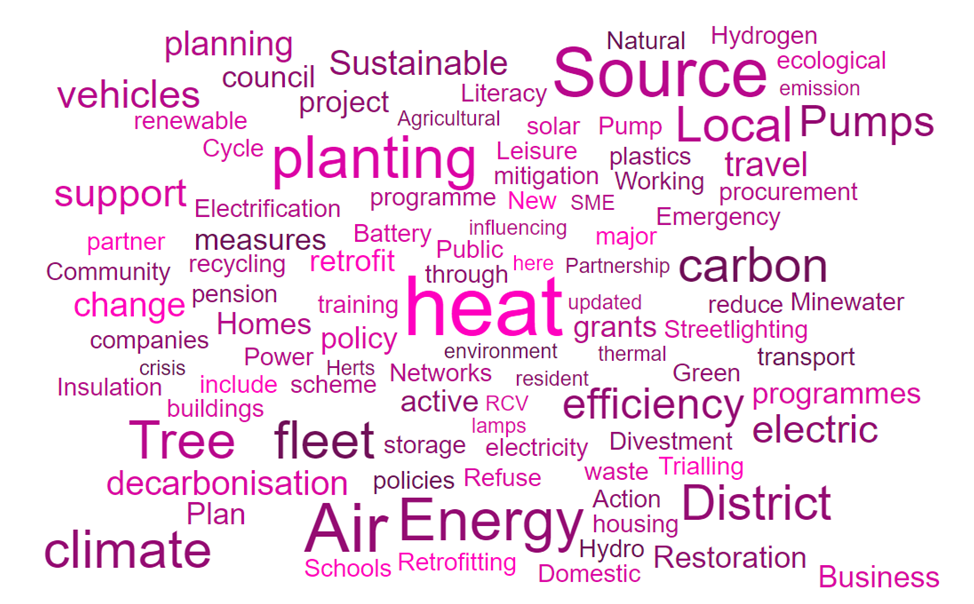
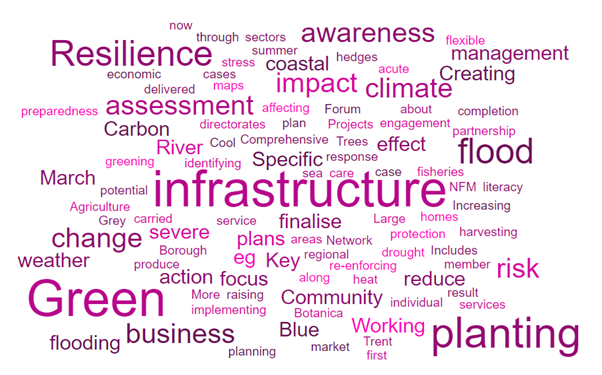
Figure 10 shows the relative frequency of words included in the comments around other mitigation project areas employed (Figure 10 and all sub sequent word clouds in this support were produced using https://worditout.com.)
Flooding and other climate related incidents
Respondents were asked whether their authority’s local area had been affected by a climate related incident in the past five years. As Table 28 shows, over 70 per cent of respondents reported that their authority’s local area had been affected by a climate related incident in this time
|
Per cent |
|
|---|---|
|
Yes |
71% |
|
No |
14% |
|
Don’t know |
15% |
Base: all respondents who answered the question (174 respondents).
Those respondents who indicated that there had been a climate related incident were asked to briefly specify the nature and consequences of this incident in an open text box. In all, 122 respondents provided textual information of this nature. These responses can be grouped into the following categories:
The nature of the climate related incidents:
- Flooding (120 respondents);
- Heatwaves, heat damage and wildfires (23 respondents);
- Storms (seven respondents);
- Water shortages and droughts (five respondents);
- Coastal erosion and rising sea levels (five respondents);
- Cold weather (three respondents);
- Landslips or landslides (two respondents);
- A variety of climate related incidents mentioned by one respondent each:
- Trees falling
- Drying of chalk streams
- Water pollution
- Strong winds
The consequences of the climate related incidents:
- Damage caused to homes (25 respondents);
- Damage to property (15 respondents);
- Difficulties caused to businesses and livelihoods (13 respondents);
- Disruption to travel and transport networks (nine respondents);
- Risk to or loss of lives (three respondents);
- Strain on council services due to additional requests for support (two respondents);
- Vulnerable groups at risk of physical or mental illness (two respondents);
- A variety of consequences mentioned by one respondent each:
- Decreasing biodiversity
- Disruption to electricity network
- Increased disruption to adults' social services
- Increasing deprivation
- People evacuated
- Poor crop yields
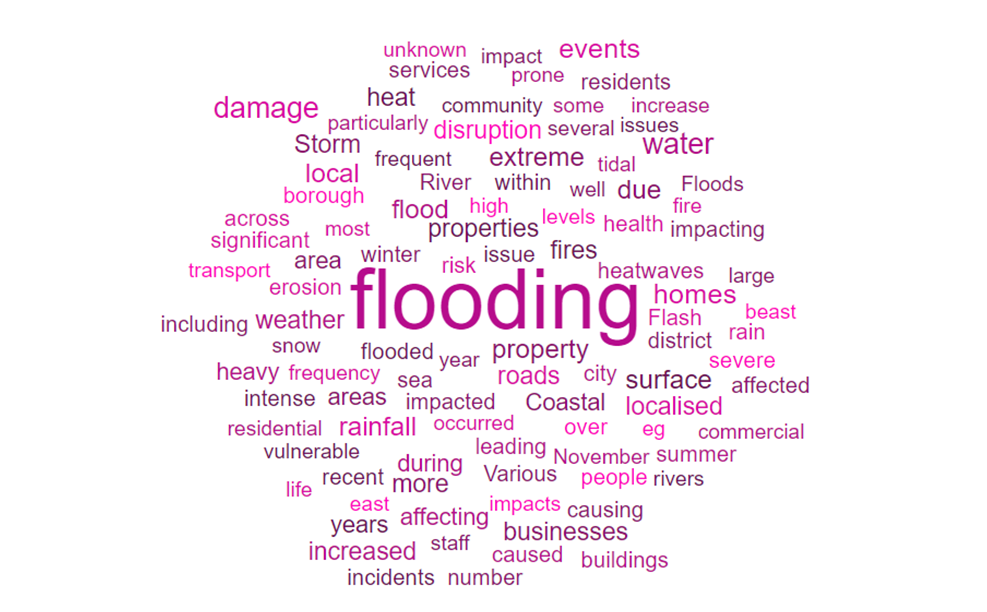
Figure 11 shows the relative frequency of words mentioned in these comments.
Embedding of climate change risks in corporate risk registers
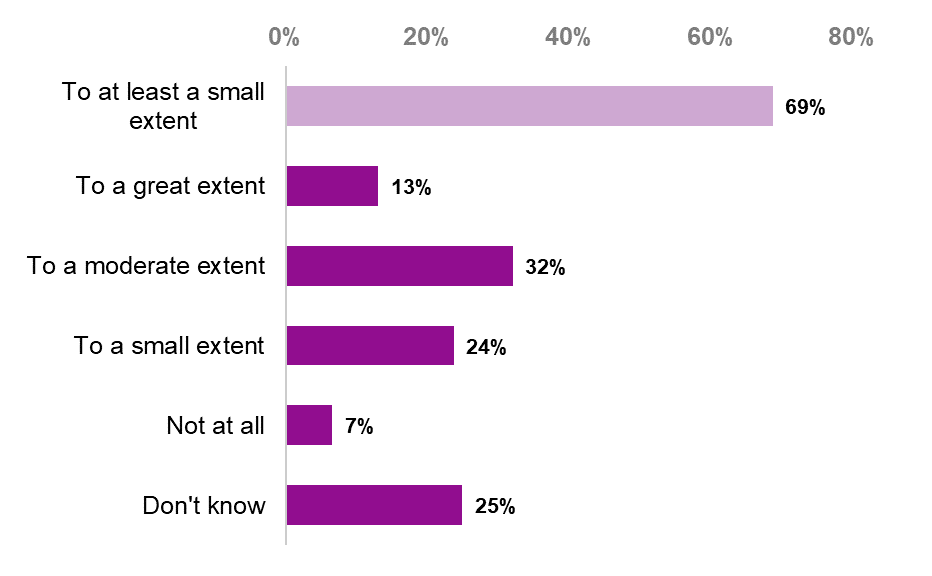
Respondents were asked the extent to which their local authority has climate related risks embedded in its corporate risk register. As Table 29 and Figure 12 demonstrate, 69 per cent of respondents stated that climate related risks are embedded in their risk register to at least a small extent. This includes 13 per cent of respondents who answered to a great extent, 32 per cent who answered to a moderate extent, and 24 per cent to a small extent.
|
Per cent |
|
|---|---|
|
To at least a small extent |
69% |
|
To a great extent |
13% |
|
To a moderate extent |
32% |
|
To a small extent |
24% |
|
Not at all |
7% |
|
Don't know |
25% |
Base: all respondents who answered the question (169 respondents).
Climate change adaptation project areas delivered
Respondents were asked to indicate which of a series of climate change adaptation project areas their authority had delivered in the last ten years, was delivering currently, or planned to deliver in future. Respondents could select any answer that applied, including multiple responses for each adaptation project area.
Table 30 shows the responses as percentages of the total number of respondents to this question. It shows that the most prevalent adaptation project areas overall were wildlife protection and biodiversity, sustainable urban drainage, flood awareness campaigns for residents and minimum flood resilience criteria for new developments in flood-risk areas. Project areas more frequently delivered in the past than in the present or planned for the future included contingency plans for vulnerable people and the wider community and heat wave awareness campaigns. Project areas delivered frequently at present but not planned as frequently for the future included wildlife protection and biodiversity, sustainable urban drainage, flood awareness campaigns, minimum flood resilience criteria, and installation of flood defences. The only project area more frequently planned for the future than delivered at present was retrofitting existing buildings against climate change.
|
|
Have previously delivered in the last ten years |
Delivering currently |
Plan to deliver in the next two years |
Plan to deliver in the longer term |
|---|---|---|---|---|
|
Wildlife protection and biodiversity |
41% |
58% |
38% |
30% |
|
Sustainable urban drainage |
39% |
54% |
29% |
26% |
|
Flood awareness campaigns for residents |
39% |
38% |
24% |
21% |
|
Minimum flood resilience criteria for new developments in flood-risk areas |
28% |
45% |
23% |
19% |
|
Future proofing new buildings against climate change |
16% |
31% |
30% |
25% |
|
Retrofitting existing buildings against climate change |
16% |
28% |
29% |
29% |
|
Installation of flood defences |
33% |
38% |
14% |
15% |
|
Contingency plans for vulnerable people in heat waves, flooding etc. |
31% |
28% |
21% |
18% |
|
Contingency plans for the wider community in heat waves, flooding etc. |
30% |
29% |
20% |
16% |
|
Heat wave awareness campaigns for residents |
25% |
13% |
19% |
13% |
|
Other adaptation project areas |
8% |
11% |
7% |
6% |
Base: all respondents who answered this question (160 respondents).
The other adaptation project areas specified by the respondents were grouped into the following broad categories, some of which were variations on the options provided in the questionnaire:
- Green infrastructure, for example green roofs (five respondents);
- Tree planting as a method of climate change adaptation (five respondents);
- Natural flood management (three respondents);
- Plans and strategies (three respondents);
- Risk and impact assessments (three respondents);
- Coastal protection schemes (two respondents);
- Support to and engagement with businesses and sectors of industry (two respondents);
- A collection of other project areas mentioned by one respondent each:
- Blue infrastructure
- Community resilience projects
- De-culverting watercourses
- Drought resilience projects
- Heat stress monitoring and reduction
- Local resilience fora and networks
- More flexible transport and infrastructure management adapting to less predictable seasons
- Raising awareness of climate change risks with care providers
- Training for council staff
- Wildfire awareness campaigns
Figure 13 shows the relative frequency of words included in the comments around other adaptation project areas employed.
Partnerships to reduce carbon emissions
Respondents were asked whether their authority had existing or planned partnerships with a range of other organisations to reduce carbon emissions. As Table 31 shows, the organisations which authorities most often had existing or planned partnerships with were other local authorities, followed by other specified organisations, local energy hubs, and various local partners and community groups including residents’ groups. Partnerships already in place generally outnumbered planned partnerships, with exceptions being private landlords and the Carbon Trust, where more respondents said that they were planning partnerships than had existing partnerships already in place. Types of organisation which respondents predominantly had no plans to establish partnerships with included the Carbon Trust, the Energy Saving Trust Advice Centre and energy generators and suppliers.
The other organisations with established or planned partnerships can be grouped into the following categories:
- Local Enterprise Partnerships (four respondents);
- Charities (two respondents);
- Wildlife Trusts (two respondents);
- A variety of other organisations and types of organisation which were mentioned by one respondent each:
- Canal Trust
- Chambers of Commerce
- Climate Action Partnerships
- Climate Commissions
- Collaboration with a range of stakeholders without formal partnerships
- Councils for Voluntary Services
- Energy Systems Catapult
- Levelling Up Fund
- Local Nature Partnerships
- National Farmers Union
- Rivers Trust
- Small and large businesses other than those already mentioned elsewhere
- Town and Parish Councils
- Utility companies beyond energy generators and suppliers
|
|
Partnership in place |
Partnership planned in future |
No planned partnership currently |
|---|---|---|---|
|
Other local authorities |
79% |
15% |
6% |
|
Other organisations (please specify) |
79% |
11% |
0% |
|
Local energy hubs |
66% |
18% |
8% |
|
Other local partners/community groups |
60% |
23% |
8% |
|
Local residents or residents' groups |
46% |
34% |
15% |
|
Universities |
47% |
23% |
15% |
|
Schools |
42% |
27% |
18% |
|
Local/regional energy efficiency agencies |
45% |
20% |
15% |
|
Further education providers |
35% |
29% |
20% |
|
Registered social landlords |
42% |
21% |
17% |
|
Local Partnerships |
44% |
16% |
22% |
|
NHS bodies |
32% |
26% |
26% |
|
Private landlords |
21% |
26% |
31% |
|
Energy suppliers |
31% |
15% |
33% |
|
Commercial consultancies |
28% |
14% |
35% |
|
Anthesis (SCATTER) |
27% |
11% |
39% |
|
Energy generators |
20% |
18% |
41% |
|
Energy Saving Trust Advice Centre |
25% |
13% |
40% |
|
Carbon Trust (CT) |
9% |
10% |
55% |
Barriers to tackling climate change
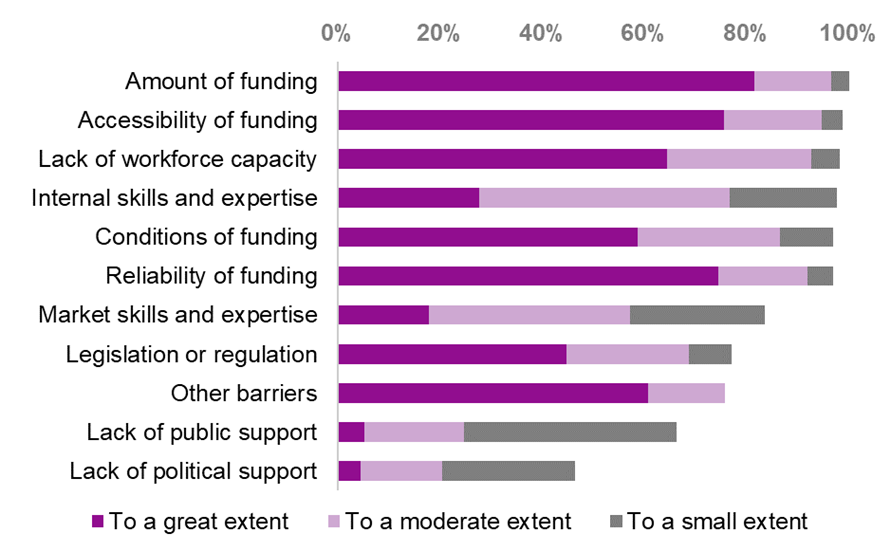
Respondents were asked the extent to which a variety of factors were a barrier to their authority tackling climate change. As Table 32 and Figure 14 show, the most frequently reported barriers were amount of funding (97 per cent to a great or moderate extent), accessibility of funding (94 per cent), lack of workforce capacity (92 per cent), internal skills and expertise (77 per cent), conditions of funding (87 per cent), and reliability of funding (74 per cent). Among some selected barriers, such as the amount, the accessibility, and the reliability of funding, the barrier tended to predominantly exist to a great extent, whereas other barriers, such as skills and expertise and lack of support, existed more often only to a small extent.
|
|
To a great extent (per cent) |
To a moderate extent (per cent) |
To a small extent (per cent) |
Not at all (per cent) |
Base (all respondents who answered the question) |
|---|---|---|---|---|---|
|
Amount of funding |
82% |
15% |
4% |
0% |
168 |
|
Accessibility of funding |
75% |
19% |
4% |
0% |
167 |
|
Lack of workforce capacity |
64% |
28% |
6% |
1% |
163 |
|
Internal skills and expertise |
28% |
49% |
21% |
2% |
163 |
|
Conditions of funding |
59% |
28% |
10% |
1% |
162 |
|
Reliability of funding |
74% |
18% |
5% |
1% |
160 |
|
Market skills and expertise |
18% |
39% |
26% |
7% |
152 |
|
Legislation or regulation |
45% |
24% |
8% |
5% |
96 |
|
Other barriers |
61% |
15% |
0% |
3% |
33 |
|
Lack of public support |
5% |
19% |
42% |
27% |
154 |
|
Lack of political support |
4% |
16% |
26% |
50% |
157 |
Respondents who identified legislation or regulation as a barrier to tackling climate change were asked to specify which pieces of legislation or regulation were presenting such barriers. The categories which emerged were as follows:
- National Planning Policy Framework and other planning legislation and regulation, generally regarded as insufficiently rigorous in environmental terms (28 respondents);
- Building regulations, also regarded as insufficiently rigorous (13 respondents);
- Clarity and leadership required from central government and the national policy position (four respondents);
- Lack of statutory responsibility (four respondents);
- Removal of energy performance and generation incentives (two respondents);
- A variety of other pieces of legislation and regulation which were mentioned by one respondent each:
- Removal of the Renewable Heat Incentive (RHI)
- Future Homes Standard
- Issue with standards not being sufficiently enforceable
- National policy on onshore wind
- Procurement regulations
- Need for legislation to support and enable decentralised energy generation
- The Department for Transport’s approach to funding transport schemes
- Ventilation requirements to help prevent COVID-19 and other illnesses resulting in heat loss
- Taxation
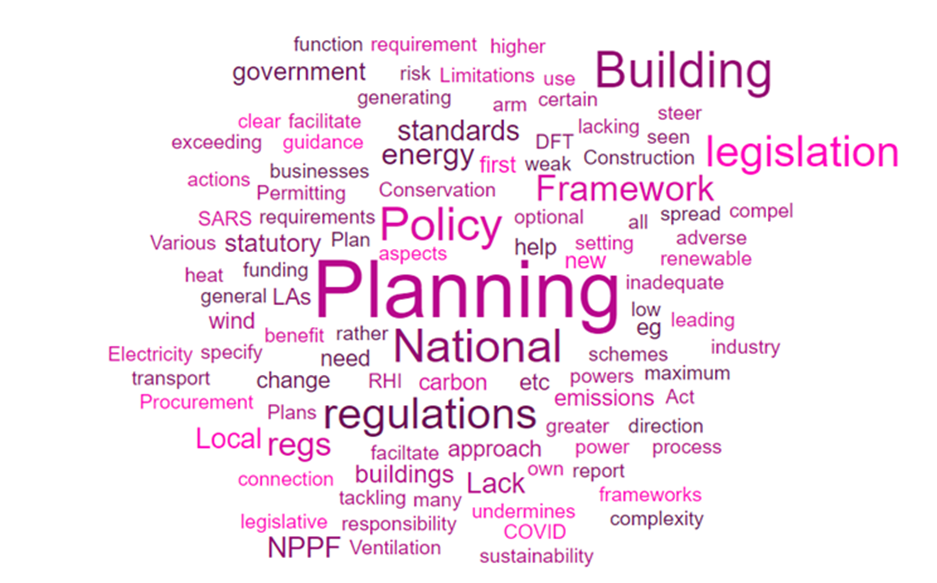
Figure 15 shows the relative frequency of words provided in relation to legislative and regulatory barriers.
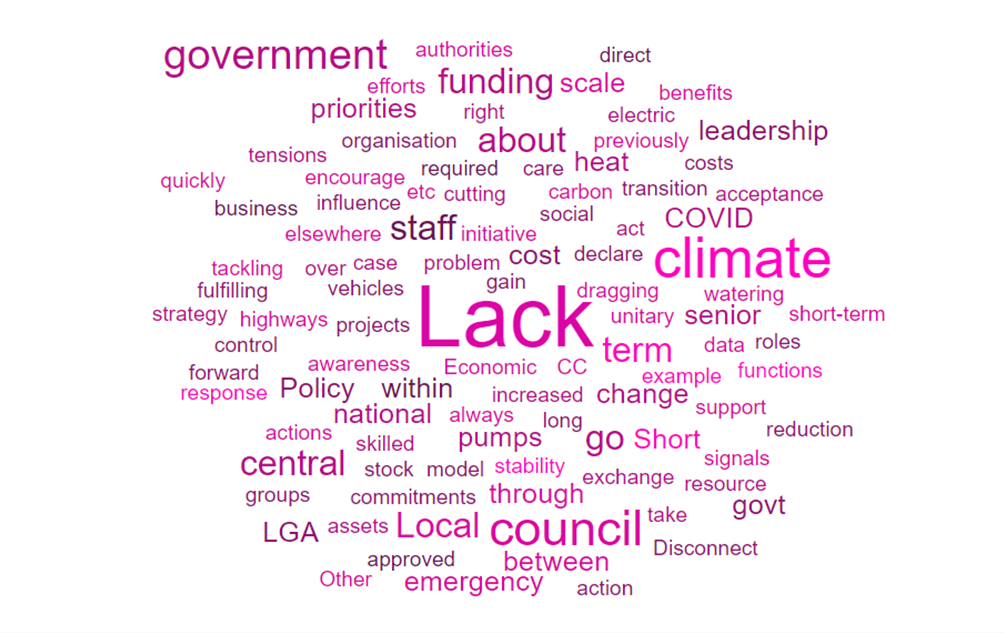
Respondents were also asked to specify which other barriers exist to their authority tackling climate change. The additional barriers provided by respondents were as follows:
- Lack of senior ownership and leadership within the council (three respondents);
- Competing priorities with statutory functions and other council objectives (three respondents);
- Lack of data on climate change projects delivered elsewhere (two respondents);
- Lack of awareness of the scale and speed of the change required (two respondents);
- Lack of instructions or guidance for initiating renewable projects (two respondents);
- A variety of other barriers mentioned by one respondent each, including:
- Difficulty coordinating between county and borough councils in two-tier areas
- Disconnect with climate change programmes and related topics, such as biodiversity
- Distraction caused by the COVID-19 response
- High cost of capital expenditure and technology
- Increased energy bills arising from renewable generation methods
- Lack of availability of local government-specific carbon reduction modelling tools
- Lack of direct influence or control over the main sources of emissions
- Lack of knowledge of available funding
- Local authority transitions and reorganisations
- Local barriers to attracting skilled staff
- Loss of funding resulting from exiting the European Union
- Multiple steps for corporate sign-off required for new initiatives
- Need to review and plan assets and resources
- Poor relationships with pressure groups
- Requirement to prioritise short-term gain for economic survival
- Short-term strategic roles within the council
Figure 16 shows the relative frequency of words provided to explain these additional barriers to tackling climate change.
Further comments
Respondents were asked if there were any further issues relating to their authority’s climate change situation that could be helpful to share. Their comments fell into the following broad patterns:
- Some respondents mentioned other examples of strategies, partnerships and work that was in progress within their local authority, whilst acknowledging that much work remained to be done;
“We recognize that we are in the relatively initial stages to our commitment regarding climate change and we are currently developing partnerships and initiatives that will make a meaningful difference.”
- Some provided further examples of ongoing actions to tackle climate change, some of which had been underway for many years;
“The council has consistently been taking action on climate change for decades.”
- Some commented on the problematic status of much of the information and guidance on the subject of climate change:
- A lack of clarity on targets and required actions to avoid environmental devastation. One example is the diversity of carbon neutral targets asked for in this survey, and the fact that many of these targets were in fact net zero targets, a distinct concept;
- Difficulty providing some of the required information about carbon footprints;
- A lack of capacity or understanding of the key issues among the most influential stakeholders.
- Some commented about additional issues in relation to the funding of climate change work:
- An observation that revenue funding for climate change activity is lacking, most of the funding being for capital projects, with funding for ongoing action to combat climate change hard to come by;
- A noted lack of grants and support beyond early adopters, without sustained funding available for the main body of authorities or those scaling up programmes already trialled.
- Some provided examples of work areas and issues which tend to distract attention and resources from climate change work:
- Urgent and acute pressures taking precedence over long-term issues such as climate change;
- Most prominently, the COVID-19 pandemic and its disruptive effect on climate change activities.
- Some cited additional difficulties faced by particular types of authorities, including:
- Those in two-tier systems, owing to the increased difficulty of coordinating services between county and district councils;
- Those undergoing restructuring or reorganization, as this process diverts resources from other work including climate change;
- Small authorities, which find it difficult to gather the capacity necessary to make funding bids to scale up their climate change programmes;
- Rural authorities, due to lack of infrastructure and reliance on private cars for transport.
- Some referred to issues among their climate change specific staff, including:
- Lack of staff numbers; difficulty recruiting and retaining staff of the required skills;
- Having no one member of staff responsible for climate change work, with work of this sort only accounting for a portion of officers’ capacity and often being spread out across individuals and teams;
- Having some staff focused exclusively on climate change, yet relatively new in their posts and still learning about the field;
- Low morale among officers responsible for implementing climate change measures, including a feeling that the scale of the problem and the action required to combat it is overwhelming.
- Some commented on the need for partnerships and initiatives transcending individual local authorities, including:
- The need to recognize the limited influence and control which local authorities have over some sectors and industries, such as agriculture and aviation, and particularly those which work across local authority boundaries;
- The need for direction, leadership and instruction from central government and other nationwide and regional agencies;
- The need for buy-in across wide range of networks and stakeholders to achieve lasting impact;
- The benefits arising from shared targets and priorities across groups and networks of local authorities;
- The potential savings to be gained by sharing resources and intelligence across councils;
- Reports of successful outcomes from regular, focused meetings bringing a wide range of stakeholders together;
- Some commented about limited instances of public or political opposition to implementing climate change measures:
- Opposition to on-street charging among some partner organisations;
- The observation that achieving political support is far easier with regards to some climate change actions than others; climate change actions less likely to be popular among local communities are considerably harder to find approval for.
Annex A: Questionnaire
Please provide or amend your personal details below.
If you wish to respond on behalf of more than one authority, or to provide a retrospective response on behalf of an authority which no longer exists, please contact James Harman at [email protected].
- Name
- Job Title
- Authority
- Email address
1. To what extent are you aware of the following forms of support around climate change that the LGA provides?
- To a great extent
- To a moderate extent
- To a small extent
- Not at all
- LGA and Local Partnerships Greenhouse Gas Accounting tool (1)
- The Net Zero Innovation Programme (2)
- LGA Green Webinars Series eg. biodiversity, energy, community engagement and LGA conference (3)
- LGA Climate Change E-bulletin (4)
- The Climate Emergency Knowledge Hub (5)
- Climate Change Case Studies including the Pass the Planet campaign (6)
- The LGA Climate Change Webpage Support Hub (7)
- The Leading and Learning Green Jobs Programme (action learning sets) (8)
- LGA Climate Change Communications Guide (9)
- LGA Behaviour Change and the Environment Guide (10)
- LGA Leadership Essentials: Climate Emergency (11)
- The Design in the Public Sector Programme (12)
- The Centre for Governance and Scrutiny Guidance – 10 questions to scrutinise climate action (13)
- Local Action for Our Environment podcast (14)
- The Local Pathway to Net Zero Guidance for Councillors (15)
- LGA Biodiversity e-learning (20)
- Access to reduced rate local authority pricing for Aurora Energy Research market forecasts through Local Partnerships (22)
- Other (please specify below) (16)
2. Overall, how satisfied or dissatisfied are you with the support offered through the LGA Climate Change Sector Support Programme?
- Very satisfied
- Fairly satisfied
- Neither satisfied nor dissatisfied
- Fairly dissatisfied
- Very dissatisfied
- Don't know
- Not applicable
3. How likely would you be to recommend the LGA Climate Change Sector Support Programme to other councils?
- Very likely
- Fairly likely
- Not very likely
- Not at all likely
- Don't know
4. To what extent, if at all, do you think that the climate change support your authority has received from the LGA has had a positive impact on your council?
- To a great extent
- To a moderate extent
- To a small extent
- Not at all
- Don't know
- Not applicable
5. In what areas, if any, could your authority benefit from expertise, skills and support delivered by the LGA?
Please select all that apply. This question includes both types of climate change action the LGA may be able to support you with, and specific types of support the LGA may be able to offer you.
- Low carbon procurement (1)
- Energy support, including renewable energy and local area energy planning (2)
- Electric vehicle charging infrastructure (32)
- Energy efficient building measures (33)
- Green economic planning (4)
- Communications on climate change (5)
- Educating the public/changing public behaviour (6)
- Biodiversity (18)
- Adaptation to changing climates (30)
- Sustainable urban/town/rural planning (7)
- Sustainable transport planning (8)
- Carbon auditing (9)
- Carbon budgeting (10)
- Embedding carbon considerations into decision-making (11)
- Climate justice (12)
- Other area(s) of climate action (please specify) (13)
- Good practice and case studies (19)
- Sector specific good practice guidance on scope 3 emissions (20)
- Peer benchmarking (21)
- Bespoke council peer support (22)
- Leadership programmes (23)
- Action learning sets (24)
- Podcasts (25)
- Climate change workshops and events (26)
- Other expertise of method(s) of support (please specify below) (27)
- None of the above (28)
6. What would you say are the main challenges to securing the needed expertise and skills in climate change work?
Please select all that apply.
- Short-term funding necessitating 12-month contracts (1)
- Inability to compete with other employers in terms of salaries (2)
- Difficulty finding candidates with the required skills (3)
- Difficulty upskilling current staff capacity (4)
- Uncertainty as to which areas in need of further development should be prioritised (6)
- Uncertainty as to what expertise and skills should be prioritised (5)
- Other (please specify below) (7)
7. Is your authority currently measuring, or not measuring, the carbon emissions of the following?
You can find more information on the difference between scope 1, 2 and 3 emissions here.
- Yes, already measured
- No, but plans to measure in development
- No, and no current plans to develop measures yet
- Don't know
- Your authority - scope 1 and 2 (1)
- Your authority - scope 3 (2)
- Your authority's local area - scope 1 and 2 (3)
- Your authority's local area - scope 3 (4)
8. In which financial years were the latest carbon emissions measured?
- 2017/17 or earlier (1)
- 2018/19 (2)
- 2019/20 (3)
- 2020/21 (4)
- 2021/22 (5)
9. Which method or tool did you use to arrive at your authority's latest carbon emissions?
- LGA and Local Partnerships Greenhouse Gas Accounting Tool (1)
- Your own council’s tool (2)
- External consultancy (4)
- Other (please specify below) (3)
10. Which method or tool did you use to arrive at your area's latest carbon emissions?
- SCATTER tool (1)
- BEIS National Atmospheric Emissions Inventory (5)
- Your own council’s tool (2)
- External consultancy (4)
- Other (please specify below) (3)
11. Please provide the latest carbon emissions measured, if they are available.
Please use units of tonnes of CO2 per year.
- Your authority - scope 1 and 2 (1)
- Your authority - scope 3 (2)
- Your authority's local area - scope 1 and 2 (3)
- Your authority's local area - scope 3 (4)
12. How often does your authority publish its carbon baseline?
- More often than annually
- Annually
- Less often than annually
- Never
- Don't know
13. Has your authority set an official target for becoming carbon neutral?
Please select all that apply.
- Yes, for the authority itself
- Yes, for the area as a whole
- No
- Don't know
14. Does your authority's target include scope 3 emissions, or just scope 1 and 2 emissions?
You can find more information on the difference between scope 1, 2 and 3 emissions here. If this information is too difficult to provide, please feel free to leave this question blank.
- Includes scope 1, 2 and 3 emissions (1)
- Scope 1 and 2 emissions only (2)
- Other (please specify below) (3)
- Don't know (4)
15. Does your area's target include scope 3 emissions, or just scope 1 and 2 emissions?
You can find more information on the difference between scope 1, 2 and 3 emissions here. If this information is too difficult to provide, please feel free to leave this question blank.
- Includes scope 1, 2 and 3 emissions (1)
- Scope 1 and 2 emissions only (2)
- Other (please specify below) (3)
- Don't know (4)
16. Please specify the date by which your authority is targeted to become carbon neutral.
17. Please specify the date by which your authority's area is targeted to become carbon neutral.
18. Is there an executive council member of your authority whose portfolio specifies a lead role on climate change?
- Yes (1)
- No (2)
- Don't know (3)
19. Does your authority have an agreed and up to date climate change strategy?
- Yes, already being delivered (1)
- Yes, completed but not yet being delivered (3)
- No, but currently in development (4)
- No, but planning to produce one (5)
- No, and no current plans to produce one yet (6)
- Don't know (7)
20. Does or will the climate change strategy cover climate change mitigation, climate change adaptation, or both?
- Both mitigation and adaptation (1)
- Mitigation only (2)
- Adaptation only (3)
- Don't know (4)
21. Does your authority have specific financial and/or staffing resources that have already been secured to implement the strategy?
- Yes, all of the resources required to implement it (1)
- Yes, some of the resources required to implement it (5)
- No (2)
- Don't know (3)
22. Please provide an approximate percentage breakdown of the sources providing the funding already secured to implement your authority's strategy.
Please ensure the total adds up to 100 per cent.
- Government grants : _______ (1)
- Core funding : _______ (2)
- Reserves : _______ (3)
- Private investment : _______ (4)
- Loans : _______ (5)
- Crowdsourcing : _______ (6)
- Other funding sources : _______ (7)
- Total : ________
23. In which financial year will the funding already secured for the strategy first be provided?
- Already in place as of 2021/22 (1)
- 2022/23 (2)
- Beyond 2022/23 (3)
- Don't know (5)
- Mitigation (1)
- Adaptation (2)
24. Please estimate the approximate amount of funding already secured to implement the strategy in the following periods.
In each of the periods, please provide the funding secured per year within that period. If this information is too difficult to provide, please feel free to leave this question blank.
- Already in place as of 2021/22 (1)
- 2022/23 (2)
- Beyond 2022/23 (3)
- Total funding (1)
25. Please estimate the approximate amount of additional funding (i.e. not including funding already secured) that will be required to implement climate change measures over the following time periods.
Please make your estimates cumulative (e.g. funding required for the next five years is included within funding required for the next ten years). Please provide the total amount required, not the amount required per year. If this information is too difficult to provide, please feel free to leave all or part of this question blank.
- The next five financial years (1)
- The next ten financial years (2)
- The next fifteen financial years (3)
- The next twenty financial years (4)
- Additional funding required (1)
26. Does your authority have a communications plan for climate change?
- Yes, being delivered (1)
- Yes, completed but not yet being delivered (3)
- No, but in development (4)
- No, but planning to produce one (6)
- No, and no current plans to produce one yet (7)
- Don't know (8)
27. Please specify the principal aims of your authority's communications plan.
Please select all that apply.
- To influence behaviour change among residents (1)
- To influence behaviour change among local businesses (9)
- To influence behaviour change among staff (2)
- To showcase the authority's climate change actions (3)
- To increase awareness of local climate change support schemes (4)
- To increase awareness of national climate change support schemes (5)
- To transmit information on climate change beyond the authority (6)
- To solicit information on climate change within the authority (7)
- Other (please specify below) (8)
28. Which of the following communications activities are you undertaking or planning to undertake around climate change?
Please select all that apply.
- Website messaging (1)
- Surveys (8)
- Blog activity (2)
- Local events (3)
- Parish and town council engagement (4)
- Social media activity (9)
- Citizens and/or youth assemblies or juries (5)
- Other (please specify below) (6)
- None of the above (7)
29. Which, if any, of the following climate change mitigation project areas has your authority delivered in the last ten years, is delivering currently, or has plans to deliver in future?
You may select more than one response for each project area.
- Have previously delivered in the last ten years (1)
- Delivering currently (2)
- Plan to deliver in the next two years (3)
- Plan to deliver in the longer term (4)
- Have not delivered and have no current plans to deliver yet (5)
- Don't know (6)
- Wind energy (1)
- Ground source heat pumps (2)
- Small-scale solar photovoltaic installations (less than 1MW) (3)
- Large-scale solar photovoltaic installations (1MW or greater) (19)
- Solar water heating (4)
- Energy from waste (5)
- Combined heat and power (excluding waste schemes) (6)
- Energy from biomass (7)
- Biofuels or biogas (8)
- Installation of energy saving measures in the council's own building stock (9)
- Installation of energy saving measures in community buildings (10)
- Increasing bus routes (11)
- Introducing hybrid or electric buses on bus routes (12)
- Electric charging points (13)
- Communications campaigns around climate change mitigation (14)
- Divestment from companies posing an environmental risk, for example oil companies, in your authorities assets and pension scheme (15)
- Other climate change mitigation project 1 (please specify) (16)
- Other climate change mitigation project 2 (please specify) (17)
- Other climate change mitigation project 3 (please specify) (18)
30. Has your authority's local area been affected by a climate related incident in the last five years?
- Yes (1)
- No (2)
- Don't know (3)
31. Please briefly describe the nature and consequences of the climate related incident(s).
32. To what extent does your local authority have climate related risks embedded in your corporate risk register?
- To a great extent (1)
- To a moderate extent (2)
- To a small extent (3)
- Not at all (4)
- Don't know (5)
33. Which, if any, of the following climate change adaptation project areas has your authority delivered in the last ten years, is delivering currently, or has plans to deliver in the next ten years?
You may select more than one response for each project area.
- Have previously delivered in the last ten years (1)
- Delivering currently (2)
- Plan to deliver in the next two years (3)
- Plan to deliver in the longer term (4)
- Have not delivered and have no current plans to deliver yet (5)
- Don't know (6)
- Flood awareness campaigns for residents (1)
- Heat wave awareness campaigns for residents (2)
- Contingency plans for vulnerable people in heat waves, flooding etc. (3)
- Contingency plans for the wider community in heat waves, flooding etc. (4)
- Minimum flood resilience criteria for new developments in flood-risk areas (5)
- Future proofing new buildings against climate change (6)
- Retrofitting existing buildings against climate change (13)
- Sustainable urban drainage (7)
- Installation of flood defences (8)
- Wildlife protection and biodiversity (9)
- Other climate change adaption project 1 (please specify) (10)
- Other climate change adaption project 2 (please specify) (11)
- Other climate change adaption project 3 (please specify) (12)
34. Does your authority have partnerships in place, or have plans to put partnerships in place, with any of the following bodies to reduce carbon emissions?
Please select all that apply.
- Partnership in place (1)
- Partnership planned in future (2)
- No planned partnership currently (3)
- Don't know or not applicable (4)
- Other local authorities (1)
- NHS bodies (2)
- Local residents or residents' groups (3)
- Private landlords (4)
- Registered social landlords (5)
- Local Partnerships (6)
- Carbon Trust (CT) (7)
- Energy Saving Trust Advice Centre (8)
- Energy suppliers (9)
- Energy generators (10)
- Commercial consultancies (11)
- Anthesis (SCATTER) (12)
- Schools (16)
- Further education providers (18)
- Universities (19)
- Local/regional energy efficiency agencies (13)
- Local energy hubs (17)
- Other local partners/community groups (14)
- Other organisations (please specify) (15)
35. To what extent are the following factors a barrier to your authority tackling climate change?
- To a great extent (1)
- To a moderate extent (2)
- To a small extent (3)
- Not at all (4)
- Don't know (5)
- Amount of funding (1)
- Accessibility of funding (10)
- Reliability of funding (12)
- Conditions of funding (11)
- Legislation or regulation (please specify) (2)
- Skills and expertise available internally (3)
- Skills and expertise available in the market (13)
- Lack of workforce capacity (9)
- Lack of public support (4)
- Lack of political support from the council (5)
- Other barrier 1 (please specify) (6)
- Other barrier 2 (please specify) (7)
- Other barrier 3 (please specify) (8)
36. Are there any further issues relating to your authority's climate situation that could be helpful to share?
37. Finally, has your council done anything interesting or notable in relation to climate change that you would like to share with other authorities?
The LGA is showcasing councils' excellent work. If you would like to contribute or if you are doing something innovative locally that you would like to share, please fill out this case study form or contact [email protected]. You can view all our climate change case studies via our website.
You have now reached the end of the survey. Please indicate below if you would be happy for the LGA to contact you in future about the topic of the survey and related subject areas.
You would be able to contact the LGA at any time if you no longer wish to be contacted on this topic. If you do not wish to be contacted, please leave the box below unchecked.
Yes, please contact me in future about climate change and related subject areas
Once you press the 'Submit' button below, you will have completed the survey. You will then be able to view a summary of your responses and download a PDF of the response you have provided to us.
Many thanks for taking the time to complete this survey. You are in control of any personal data that you have provided to us in your response. You can contact us at all times to have your information changed or deleted. You can find our full privacy policy here: click here to see our privacy policy.