The employer standards survey gives a voice to occupational therapists, registered social workers and non-registered social care professionals. It ensures that the workforce is listened to and enables employers to be proactive in tackling challenges.
Introduction
The social care workforce faces increasing challenges and understanding these are key to shaping a workforce that can respond and adapt to changes.
There are 3,700 identified occupational therapists filled posts working in adult social care settings of which 3,200 were employed by local authorities. The turnover rate of occupational therapists was 14.4 per cent in 2022 and this was around 400 leavers in the previous 12 months. The turnover rate was up from 12.0 per cent in 2021. The vacancy rate of occupational therapists was 11.3 per cent in 2022 and this was around 400 vacant posts. The vacancy rate was up from 7.1 per cent in 2020 and 8.9 per cent in 2021.
The employer standards survey, sometimes known as the ‘health check’, gives a voice to occupational therapists, registered social workers and non-registered social care professionals. It ensures that the workforce is listened to and enables employers to be proactive in tackling challenges.
The purpose of the survey was to better understand a number of critical questions about their experiences including:
- How well do employers deliver the employer standards?
- How do employees perceive their working environment?
- What factors influence them to remain engaged with their work and minded staying with their organisations?
The employer standards for occupational therapists set out the shared core expectations of employers which will enable occupational therapists in all employment settings to work effectively and safely.
Please note that this summary report relies primarily on data collected from occupational therapists, employed by local authorities and related agencies. While the data is considered to represent a reasonable, representative national sample, no claims are made for generalisation of the results to other areas of the UK.
Executive summary
This year, the survey received over 16,000 responses from 140 organisations which is an increase of almost 60 per cent of responses from the year before (2021). The survey this year was changed to capture the voice of occupational therapists as a separate professional group and in relation to the employer standards for occupational therapy.
This document will outline the key findings from this survey, including:
- caseloads and work allocation (highest performing standard)
- continuing professional development (lowest performing standard) and occupational therapy framework
- the differences in responses between permanently employed occupational therapists and occupational therapists who are represented by an agency, are locum/interim or independently working, in relation to:
- the employer standards
- the workplace experiences
- strategic partnerships
- recording system.
This report should be shared with DASS’s, your Principal Occupational Therapist or the most strategic OT lead within your LA or organisation with delegated duties under the Care Act.
We would encourage active engagement, action and a measured response to support your organisation to meet the national employer standards for occupational therapists.
The employer standards for occupational therapists
- Standard 1 - Strong and clear occupational therapy framework: Promoting a clear statement about the principles that constitute good occupational therapy practice.
- Standard 2 - Effective workforce planning systems: Using effective workforce planning systems to make sure that the right resources are available to meet current and future service demands.
- Standard 3 - Safe workloads and case allocation: Ensuring employees do not experience excessive workloads, resulting in unallocated cases and long waiting times for individuals.
- Standard 4 - Wellbeing: Promoting a positive culture for employee wellbeing and supporting occupational therapists to practice effectively and safely.
- Standard 5 - Supervision: Making sure students and qualified practitioners can reflect critically on their practice through integrated high quality, regular supervision.
- Standard 6 - Continuing professional development (CPD): Providing the time and opportunity for occupational therapists to learn, keep up to date and critically reflect on the impact this has on their practice.
- Standard 7 - Professional registration: This standard is about supporting occupational therapists to maintain their professional registration with the regulator.
- Standard 8 - Strategic partnerships: Creating strong partnerships and good collaboration between employers, higher education institutions and other training providers.
Participants
The survey received 1595 responses from occupational therapists, who contributed to 10 per cent of the total survey responses. As of November 2021, there were 3,200 identified occupational therapists filled posts working in adult social care settings in local authorities, showing a survey uptake of 50 per cent amongst occupational therapists who are employed by local authorities.
65 out of 150 organisations participated in the occupational therapist health check. The survey was carried out from October 2022 until January 2023. The list of organisations that took part in the occupational therapy survey can be viewed in Appendix C.
Tables 1 and 2 show the breakdown of survey responses by occupation and job category. A full list of roles can be seen in Appendix A.
Table 1
|
Occupation |
Percentage of survey responses |
|---|---|
|
Registered social workers |
49% |
|
Non-registered social care professionals |
41% |
|
Occupational therapists |
10% |
Table 2
|
Job role |
Percentage of survey responses |
|---|---|
|
Experienced occupational therapist/front-line worker |
33% |
|
Occupational therapist/front-line worker |
26% |
|
Advanced occupational therapist/ senior practitioner occupational therapist |
19% |
Table: Top three job roles by frequency
| Experienced occupational therapist/front-line worker | 513 |
| Occupational therapist/front-line worker | 416 |
| Advanced occupational therapist/ senior practitioner occupational therapist | 306 |
Mean average score
The data from the survey was interpreted using a mean average score for each question as the survey sought to measure attitudes and opinions on a scale. Respondents were asked to select options from ‘strongly disagree’ to ‘strongly agree’. The mean score is used to determine the average performance of a question so it can also be referred to as the average satisfaction score and can be converted to the same number as a percentage to indicate the average percentage of the score relative to the total score.
Scores or percentages for a question between 0-50 indicate a low outcome, scores between 51-74 indicate a moderate outcome and scores between 75-100 indicate a good outcome.
Statistical significance
This term describes a mathematical measure of difference between groups. Throughout the report, the term ‘statistically significant’ may be used. A difference of 5 percentage points demonstrates that a difference in response is statistically significant. A difference of less than 5 is not considered statistically significant, but these responses may still be shown to make comparisons.
The standards overall: How well do employers deliver the standards?
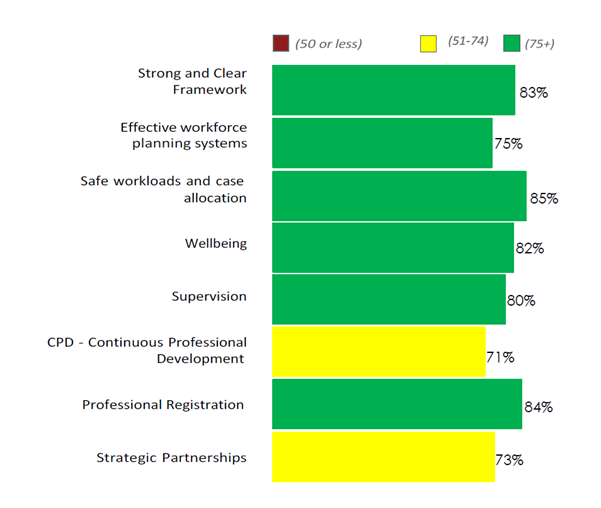
The employer standards for occupational therapists set out the shared core expectations of employers which enable occupational therapists in all employment settings to work effectively and safely. The most compliant standard rated by occupational therapists for 2022 was standard 3 (safe workloads and case allocation) with a mean score of 85 per cent and the least compliant standard was standard 6 (continuing professional development) with a mean score of 71 per cent which was a ‘moderate’ score (51-74).
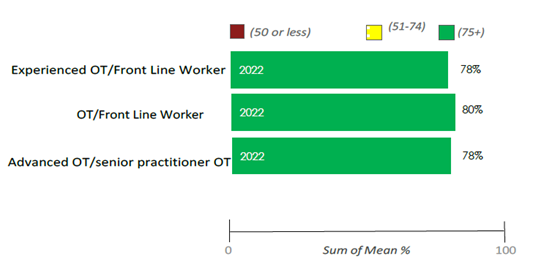
6 out of the 8 employer standards for occupational therapists received a mean score in the ‘good’ range (75+), and 2 of the standards received a score in the ‘moderate’ range, which were standard 6 (continuing professional development – mean score 71 per cent) and standard 8 (strategic partnerships – mean score 73 per cent). A breakdown of the employer standards can be seen in the image, and a further breakdown of how the top 3 most frequent roles perceived the standards overall can be seen below and in Appendix A.
Key findings
Regional differences
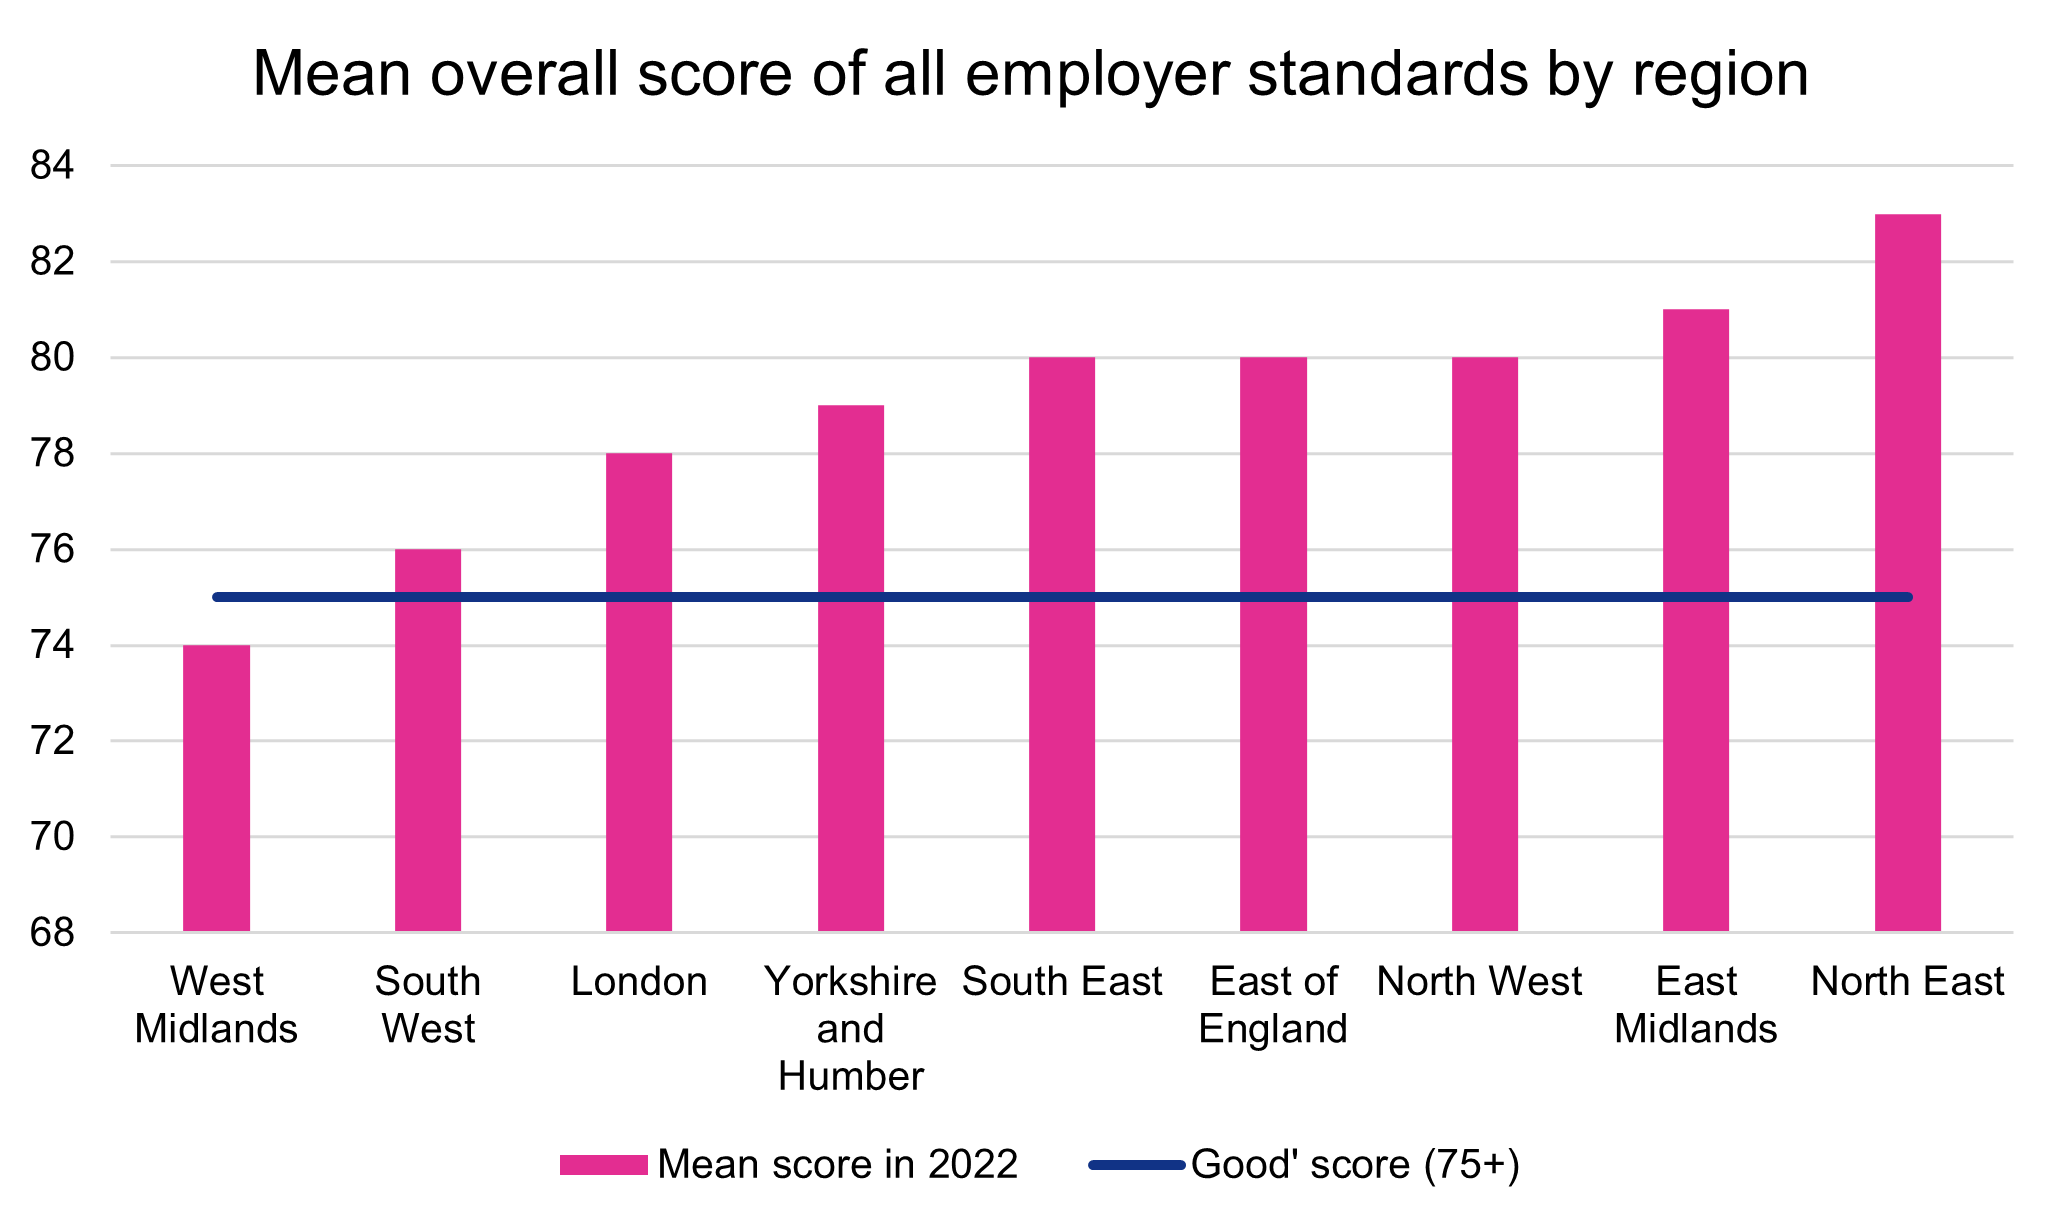
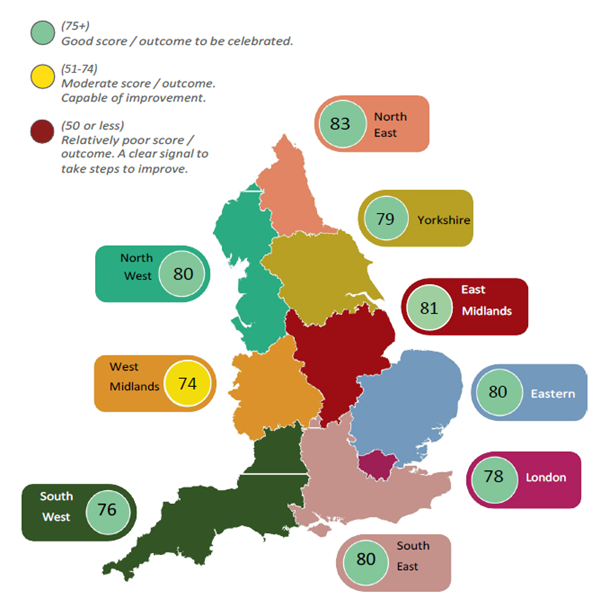
The overall mean performance of the employer standards for each region is shown below and in Appendix A.
7 out of the 8 regions responded to the standards with scores in the ‘good’ range (75+).
Occupational therapists in the North East of England responded to the standards most favourably (mean score of 83 per cent) in comparison to occupational therapists from the West Midlands who responded to the standards least favourably (mean score of 74 per cent) which shows a statistical significant difference in satisfaction of 9 percentage points between the West Midlands and North East.
Table: Mean average score of overall standards by region
|
Region |
Mean score in 2022 |
|---|---|
|
West Midlands |
74 |
|
South West |
76 |
|
London |
78 |
|
Yorkshire and Humber |
79 |
|
South East |
80 |
|
East of England |
80 |
|
North West |
80 |
|
East Midlands |
81 |
|
North East |
83 |
Workloads and case allocation
The standard in relation to workloads and case allocation (standard 3) was rated the most compliant by occupational therapists, with a mean score of 83 per cent. The responses to these questions all scored in the ‘good’ range (75+).
Occupational therapists strongly agree that they are allocated work through a fair process and that they have control over their workload. Occupational therapists feel confident in knowing where to get help if they are concerned about their well-being in relation to their workload and are comfortable discussing workload and stress issues with their supervisor or manager. They also feel safe in the role and work they are expected to do and feel able to contact their professional association and/or trade union if they are concerned about safe working, however a question from standard 4 (wellbeing), which asked occupational therapists if their organisation facilitates access to their professional association, trade union or other supportive organisations, performed less well with a difference in satisfaction of 10 percentage points. The responses can be seen below and in Appendix B.
Table: Some questions from standard 3 (safe workloads and case allocation)
|
Question |
Mean average score |
|---|---|
|
I am usually allocated (or otherwise pick up) work through a fair process that takes account of my workload, my capabilities/ skills and my health and wellbeing |
83 |
|
I know where to go to get help in my organisation if I am concerned about my well-being in respect of amount or nature of work I am expected to do |
88 |
|
I usually have a satisfactory level of control over my workload and the resources I need to fulfil my responsibilities |
80 |
|
I would feel able to contact my Professional Association and/or Trade Union if I am concerned about safe working |
85 |
Table: Question from standard 4 (wellbeing) on facilitating access to professional association, trade union and other supportive organisations
|
Question |
Mean average score |
|---|---|
|
My organisation facilitates my access to my Professional Association, Trade Union and other supportive organisations |
75 |
Continuing Professional Development (CPD) and framework
The standard in relation to continuing professional development (standard 6) was the least compliant employer standard by occupational therapists, with a mean average score of 71 per cent.
The responses to the questions about continuing professional development received some of the lowest scores in the survey. A selection of these responses can be seen below, and a larger dataset can be seen in Appendix B. Most questions in this set received ‘moderate’ scores between 59-74.
The moderate overall scores to these questions show that occupational therapists do not feel strongly satisfied that their organisation uses the Skills for Care/RCOT Framework for newly qualified staff and that this is effective in helping occupational therapy staff learn and develop. The responses also show that occupational therapists do not feel entirely satisfied that they have the dedicated time, resource, and opportunity to carry out their CPD, and do not feel that they have an up-to-date plan of their professional development needs and how their employer will contribute to them and that they can access funded non-mandatory CPD.
The tables below also show questions asked in relation to occupational therapy framework and development from 2 (effective workforce planning systems), which suggest that occupational therapists also do not feel that they have a clear workforce development pathway or that their employer uses the Skills for Care/Royal College of Occupational Therapists framework, since these responses scored in the moderate range. A similar question from standard 1 (strong and clear occupational therapy framework) showed that occupational therapists did agree however that their organisation had a well-defined framework with a mean score of 77 although this mean score was in the lower quadrant of being a good, strong response (75+), suggesting that there is still room to strengthen the occupational therapy framework approach.
Table: Questions on CPD from standard 6
|
Question |
Mean average score |
|---|---|
|
Within my organisation, I have an up-to-date plan of my professional development needs and how I and my employer will contribute to them |
69 |
|
I have dedicated time, resources, opportunities and support to carry out my CPD and record my learning in line with regulatory requirements |
62 |
|
My organisation uses the Skills for Care/RCOT framework for newly qualified staff/those new to social care, and this was effective in helping me learn and develop as an occupational therapist and be more confident |
62 |
Table: Question on development pathway from standard 2 (effective workforce planning systems)
|
Question |
Mean average score |
|---|---|
|
Through my organisation, I have a clear workforce development pathway for my job role, that supports me to do my role and keep progressing |
66 |
Table: Question on the framework from standard 1 (strong and clear occupational therapy framework)
|
Question |
Mean average score |
|---|---|
|
My organisation has a well-defined framework/approach to occupational therapy practice so I am clear about my role and accountability |
77 |
Some more of the questions in this set received scores that were close to the boundary of a ‘moderate’ (51-74) and ‘good’ (75+) range which can also be seen in Appendix B. In particular, the questions which asked occupational therapists about the effectiveness of their inductions and access to non-mandatory funded CPD received a mostly moderate response, suggesting that there is room to improve inductions for newly qualified staff. This question can be seen in the table below and in Appendix B.
Table: Question from standard 6 on inductions and funded CPD
|
Question |
Mean average score |
|---|---|
|
My organisation provides effective induction for all occupational therapy staff when they join the organisation |
73 |
|
Through my organisation, I can access funded non-mandatory CPD |
67 |
The responses show that there is clear room for improvement across continuing professional development. Focusing on particular areas like inductions and development plants that are close to scoring in a good range may be beneficial to improve satisfaction across this standard, however, there should be a long-term focus to ensure that employers are providing opportunities and support for regular and effective CPD and make use of the Skills for Care/RCOT framework, so that occupational therapists have a clear development pathway.
Strategic partnerships
The standard in relation to strategic partnerships (standard 8) was the second least compliant standard and received a mean average score of 73 per cent, which is a ‘moderate’ score (51-74).
The responses to the questions in the question set for standard 8 can be seen below. The data shows that across most of the specialisms, occupational therapists strongly agree that they have good and effective relationships with their key partners.
Further responses in this question set however suggest that occupational therapists do not feel entirely satisfied that their employer has a clear policy on recruitment, training and supporting occupational therapists since the response to this question fell in the top quadrant of the moderate range. Occupational therapists also did not respond with strong agreement when asked if they felt like an ‘equal and valued member compared to other colleagues in social care’. The response to this particular question was in the moderate range.
Table: Questions from standard 8 (strategic partnerships)
|
Questions |
Mean average score |
|---|---|
|
I have good and effective relationships with key partners such as in the NHS, wider social care, education, housing, the third sector etc |
79 |
|
My employer has a clear policy for recruiting, training and supporting occupational therapists to train as practice educators, and practice supervisors |
71 |
|
I feel like an equal and valued member of the local authority when compared to other colleagues in social care and housing |
69 |
Differences between occupational therapists who are permanently employed and occupational therapists who are represented by an agency, are locum, interim or independently working
7 per cent of occupational therapists who were surveyed were represented by an agency, were locum/interim or independently working.
Employer standards
The survey found slight, statistically insignificant differences in satisfaction across the 8 employer standards when comparing the performance of occupational therapists between those who are employed permanently and those who are represented by an agency, are locum/interim or independently working.
The table in Appendix B shows that occupational therapists who are represented by an agency, are interim, locum or independently working expressed slightly higher levels of satisfaction of 1-3 percentage points across 6 out of the 8 employer standards. Occupational therapists who are represented by an agency, are locum/interim or independently working, expressed lower levels of satisfaction than those who are permanently employed across two standards in relation to well-being (standard 4) and supervision (standard 5).
Workplace experiences
As part of the survey, occupational therapists were also asked some supplementary questions to understand how they feel about their employee experience and their employment package more generally.
Overall, occupational therapists feel a sense of pride about their job, that they are confident in carrying out their role, and would recommend their employer to a friend as these questions received scores in the ‘good’ range. They feel satisfied with their employment package, though there were interesting findings when making a comparison between the experiences of permanently employed occupational therapists, and those who are represented by an agency, are locum/interim or independently working which can be seen in the table in appendix B.
When focusing on occupational therapists’ perception of the workplace, the data showed that there were some differences in satisfaction when comparing the experiences of occupational who are permanently employed and those who are represented by an agency, are locum/interim or independently working. In particular, the strongest difference of 12-13 percentage points can be seen when occupational therapists were asked whether they feel they ‘often are required to do more with less resources’ and whether the recording system supports their practice. Similarly, a statistically significant difference of 6 percentage points can be seen in the question that asked whether occupational therapists are satisfied with their employment deal. Overall, permanently employed occupational therapists feel less satisfied with their employment package and respond less positively across every work experience question.
Appendix B shows a breakdown of all of the lowest-scoring workplace experience responses that compare occupational therapists who are employed permanently and occupational therapists who are represented by an agency, are locum/interim or independently working.
Recording system
As part of the supplementary workplace experience questions, occupational therapists were also asked about how they feel about the recording system they use, which received a ‘moderate’ response score suggesting that the recording system should be improved to support occupational therapists better.
Table: Mean average score of question on recording system from 'workplace experiences' question set
|
Question |
Mean average score |
|---|---|
|
The recording system in my organisation supports my practice as an occupational therapist/support worker |
68 |
Key drivers
Using multiple regression techniques on the data, the three ‘drivers’ - survey items having the greatest impact or potency on employees’ overall contribution in the workplace - are shown below. Improving these key drivers will have the greatest impact on occupational therapists’ contribution.
- Standard 1 – ‘I am able to use my professional judgement, creativity and decision making where appropriate’
Average mean score: 90
This question is concerned with role autonomy and being allowed to use self-judgement when dealing with workplace challenges.
- Balance of the deal – ‘Overall, I am satisfied with the employment deal - what my employer provides for me and what I am expected to provide in return.’
Average mean score: 76
This is concerned with the perception of the overall 'balance' of the employment deal and whether or not it is skewed or asymmetric in favour their employer.
- Organisational commitment – ‘As I currently see things, I do not intend to leave my employer over the next 12 months.’
Average mean score: 78
This provides a measure of organisational commitment.
Demographics
Ethnicity
The proportion of survey respondents by ethnicity and scores of the overall standards can be seen in Appendix C. Occupational therapists who were from a Black or British–African background responded to the standards the most favourably (mean average score of 85 per cent) in comparison to occupational therapists from a White – Other and White – Irish who both responded less favourably (mean average score of 76 per cent). Occupational therapists who preferred not to state their background responded the least favourably to the standards overall (mean score of 70 per cent).
For some categories, there were not enough responses to generate an overall mean score for occupational therapists.
Gender
87 per cent of surveyed registered occupational therapists identified as female, 9 per cent identified as male, and 5 per cent preferred not to state their gender. The proportion of survey respondents by gender and scores across the employer standards can be seen in Appendix C.
The performance of the standards across the male and female occupational therapists was similar however, occupational therapists who preferred not to state their gender responded the least favourably to the standards overall (mean score of 69 per cent).
Table: Comparison of the mean average scores for standards by gender
|
Gender |
Mean average overall score of standards |
|---|---|
|
Female |
80 |
|
Male |
78 |
|
Prefer not to say |
69 |
Disability
16 per cent of surveyed occupational therapists expressed that they have a disability and the performance of the standards in relation to disability can be seen below and in Appendix C. The data shows there are differences in how the standards are received when comparing occupational therapists who have a disability (mean score of 74 per cent) and those who do not have a disability (mean score of 81 per cent). Occupational therapists who declared they had a disability responded less favourably to the standards with a difference in satisfaction of 7 percentage points and those who preferred not to state if they had a disability responded the least favourably to the standards overall (mean score of 71 per cent).
Table: Comparison of mean average scores for standards by disability
|
Mean average overall score of standards |
|
|---|---|
|
Disabled |
74 |
|
Non-disabled |
81 |
|
Prefer not to say |
71 |
Conclusion
The survey has shown that occupational therapists are positively responding to their caseloads and work allocation and can address any issues they have in relation to this area (standard 3), though occupational therapists have responded to continuing professional development (standard 6) and strategic partnerships (standard 8) the least compliant out of the 8 employer standards. The summary has highlighted questions and responses to specific areas that were not performing as strongly, such as occupational therapy framework for newly qualified staff, inductions, up-to-date professional plans and access to non-mandatory funded CPD. Occupational therapists have responded that they are not strongly satisfied that their role has a clear development pathway which could be affecting their professional development and also how valued occupational therapists feel in relation to other social care colleagues.
Whilst occupational therapists strongly feel confident and prideful in their roles, there are also suggestions that occupational therapists do not feel as strongly as this towards their overall satisfaction with their employment package, and the resources and time they have to carry out their role. The report has also shown that there are clear, strong differences in favourability in relation to their overall satisfaction with their employment package and resources they have when comparing the responses to the survey from permanently employed occupational therapists and those who are represented by an agency, are locum/interim and independently working.
In relation to the overall standards, there are slight differences in satisfaction across the perception of the standards when comparing the responses to the survey from permanently employed occupational therapists and occupational therapists who are represented by an agency, are locum/interim and independently working.
The responses have shown there is room to improve the occupational therapy framework, especially for newly qualified staff, and room to improve the time, resources and opportunities available for effective continuing professional development, so that occupational therapists have a clear workforce development pathway and feel as valued as other social care colleagues.
Appendix
Appendix A
|
Job role |
Percentage of survey responses |
|---|---|
|
Experienced Occupational Therapist/front-line worker |
33% |
|
Occupational Therapist/front-line worker |
26% |
|
Advanced Occupational Therapist/ Senior practitioner Occupational Therapist |
19% |
|
Operational manager/Team Manager/Team Lead |
9% |
|
Occupational therapy support worker / occupational therapy assistant/ community care officer |
8% |
|
Principal Occupational Therapist |
2% |
|
Operational and strategic manager/ service manager (multiple teams) |
1% |
|
Occupational therapy apprentice |
1% |
|
Strategic Occupational Therapist practice lead |
Less than 1% |
|
Operational and strategic manager Group manager/ Head of Service |
Less than 1% |
|
Quality Assurance |
Less than 1% |
|
Education/Learning and Development professional |
Less than 1% |
Table: Mean average score of the 8 employer standards for occupational therapists
|
Standards |
Mean average score |
|---|---|
|
Standard 1 Strong and clear Occupational Therapy framework |
83 |
|
Standard 2 Effective workforce planning systems |
75 |
|
Standard 3 Safe workloads and case allocation |
85 |
|
Standard 4 Wellbeing |
82 |
|
Standard 5 Supervision |
80 |
|
Standard 6 Continuous Professional Development |
71 |
|
Standard 7 Professional registration |
84 |
|
Standard 8 Strategic partnerships |
73 |
Appendix B
Table: Questions from standard 3 (safe caseloads and work allocation)
|
Question |
Mean average score |
|---|---|
|
I am usually allocated (or otherwise pick up) work through a fair process that takes account of my workload, my capabilities/ skills and my health and wellbeing |
83 |
|
I know where to go to get help in my organisation if I am concerned about my well-being in respect of amount or nature of work I am expected to do |
88 |
|
I usually have a satisfactory level of control over my workload and the resources I need to fulfil my responsibilities |
80 |
|
I can discuss workload and stress issues helpfully with my supervisor or manager and agree satisfactory ways forward |
88 |
|
I would feel able to contact my Professional Association and/or Trade Union if I am concerned about safe working |
85 |
Table: Questions from standard 4 (wellbeing)
|
Question |
Mean average score |
|---|---|
|
My organisation facilitates my access to my Professional Association, Trade Union and other supportive organisations |
75 |
Table: Questions from standard 6 (continuing professional development)
|
Question |
Mean average score |
|---|---|
|
My organisation uses the Skills for Care/RCOT framework for newly qualified staff/those new to social care, and this was effective in helping me learn and develop as an occupational therapist and be more confident |
62 |
|
My organisation has non-discriminatory and transparent systems to enable all occupational therapists to develop their professional skills, knowledge, specialisms, including access to accredited courses where available |
77 |
|
My organisation provides effective induction for all occupational therapy staff when they join the organisation |
73 |
|
My organisation provides regular/ annual appraisals (or performance reviews) that are relevant for occupational therapy staff |
77 |
|
Within my organisation, I have an up-to-date plan of my professional development needs and how I and my employer will contribute to them |
69 |
|
I have dedicated time, resources, opportunities and support to carry out my CPD and record my learning in line with regulatory requirements |
62 |
|
Through my organisation, I can access funded non-mandatory CPD |
67 |
|
I take action to ensure I am up to date with my CPD |
80 |
Table: Question from standard 2 (effective workforce planning systems)
|
Question |
Mean average score |
|---|---|
|
Through my organisation, I have a clear workforce development pathway for my job role, that supports me to do my role and keep progressing |
66 |
Table: Questions from standard 8 (strategic partnerships)
|
Questions |
Mean average score |
|---|---|
|
I have good and effective relationships with key partners such as in the NHS, wider social care, education, housing, the third sector etc |
79 |
|
My employer has a clear policy for recruiting, training and supporting occupational therapists to train as practice educators, and practice supervisors |
71 |
|
I feel like an equal and valued member of the local authority when compared to other colleagues in social care and housing |
69 |
Table: Comparison of mean average scores between permanently employed and agency/locum/interim/independent occupational therapists
|
Standards |
Employed Permanently |
Agency/locum/interim/independent |
Percentage Point Difference |
|---|---|---|---|
|
Standard 1 Strong and clear Occupational Therapy framework |
75 |
76 |
+1 |
|
Standard 2 Effective workforce planning systems |
85 |
86 |
+1 |
|
Standard 3 Safe workloads and case allocation |
82 |
83 |
+1 |
|
Standard 4 Wellbeing |
80 |
77 |
-3 |
|
Standard 5 Supervision |
71 |
68 |
-3 |
|
Standard 6 Continuous Professional Development |
84 |
87 |
+3 |
|
Standard 7 Professional registration |
73 |
74 |
+1 |
|
Standard 8 Strategic partnerships |
75 |
76 |
+1 |
Table: Workplace experiences question set
|
Questions |
Mean average score |
|---|---|
|
I am confident in carrying out my role |
90 |
|
I feel a sense of pride about my job |
91 |
|
I would recommend my employer to a friend |
81 |
|
I am often required to do more with less resources |
79 |
|
The recording system in my organisation supports my practice as an occupational therapist/support worker |
68 |
|
I have opportunities to engage in research activities within my organisation that support my practice |
51 |
|
I am encouraged to contribute to the development of innovative practice in my organisation |
70 |
|
Overall, I am satisfied with my employment ‘deal’ – what my employer provides for me and what I am expected to provide in return |
76 |
|
As I see currently see things, I do not intend to leave my employer over the next 12 months |
78 |
Table: Comparison of workplace experiences questions between permanently employed and agency/locum/interim/independent occupational therapists
|
Question |
Employed Permanently |
Agency/locum/ interim/independent |
|---|---|---|
|
I am confident in carrying out my role |
90 |
93 |
|
I feel a sense of pride about my job |
91 |
94 |
|
I would recommend my employer to a friend |
80 |
85 |
|
I am often required to do more with less resources |
80 |
68 |
|
The recording system in my organisation supports my practice as an occupational therapist/support worker |
67 |
80 |
|
I have opportunities to engage in research activities within my organisation that support my practice |
51 |
52 |
|
I am encouraged to contribute to the development of innovative practice in my organisation |
69 |
70 |
|
Overall, I am satisfied with my employment ‘deal’ – what my employer provides for me and what I am expected to provide in return |
75 |
81 |
|
As I see currently see things, I do not intend to leave my employer over the next 12 months |
79 |
66 |
Appendix C
Table: Mean average score of standards in relation to ethnicity
|
Ethnicity |
Mean average overall score of standards |
|---|---|
|
Asian or Asian British - Bangladeshi |
- |
|
Asian or Asian British - Chinese |
- |
|
Asian or Asian British - Indian |
82 |
|
Asian or Asian British - Other |
- |
|
Asian or Asian British-Pakistani |
83 |
|
Black or Black British - African |
85 |
|
Black or Black British-Caribbean |
78 |
|
Black or Black British - Other |
- |
|
Mixed - White & Asian |
- |
|
Mixed - White & Black African |
- |
|
Mixed - White & Black Caribbean |
- |
|
Mixed - Other mixed |
82 |
|
White - British |
80 |
|
White - Irish |
76 |
|
White - Other |
76 |
|
Prefer not to say |
70 |
|
Any other ethnicity |
- |
Table: Mean average score of standards in relation to disability
|
|
Mean average overall score of standards |
|---|---|
|
Disabled |
74 |
|
Non-disabled |
81 |
|
Prefer not to say |
71 |
Table: Mean average score of standards in relation to gender
|
Gender |
Mean average overall score of standards |
|---|---|
|
Female |
80 |
|
Male |
78 |
|
Prefer not to say |
69 |
List of organisations that participated in the occupational therapist survey
BCP Council
Birmingham CC
Blackburn with Darwen BC
Bradford MC
Brighton and Hove City Council
Bristol City Council
Buckinghamshire Council
Calderdale Metropolitan Borough Council
Cambridge and Peterborough
Cheshire East
Cheshire West and Chester Council
Cornwall Council
Cumbria County Council
Derbyshire County Council
Devon County Council
Doncaster Metropolitan Borough Council
Dorset Council
Durham MBC
East Sussex County Council
Hartlepool Borough Council
Hertfordshire County Council
Kent County Council
Kirklees MC
LB Barnet
LB Lambeth
LB Lewisham
LB Newham
LB Southwark
Leeds City Council
Leicester City Council
Leicestershire County Council
Live Well South West Trust (Provider to Plymouth)
Liverpool City Council
Luton Borough Council
Norfolk County Council
North Somerset Council
Northumberland Council
Nottingham City Council
Nottinghamshire County Council
Oxfordshire County Council
Portsmouth City Council
RB Greenwich
Richmond and Wandsworth
Rochdale Metropolitan Borough Council
Salford NHS Trust
Sefton Metropolitan Borough Council
Shropshire Council
Solihull Metropolitan Borough Council
Somerset County Council
South Gloucestershire Council
Southampton City Council
Southend-on-Sea Borough Council
Stockton Council
Stoke-on-Trent City Council
Suffolk County Council
Sunderland City Council
Surrey County Council
Wakefield Metropolitan Council
Warwickshire County Council
West Berkshire Council
West Northamptonshire Council
West Sussex County Council
Wiltshire Council
Wokingham Borough Council
York City Council
Acknowledgements
The authors would like to especially acknowledge the support of a range of organisations:
- The Association of Directors of Adult Social Services (ADASS)
- British Association of Social Workers (BASW)
- The Department of Health (DHSC)
- Health Education England (HEE)
- Joint University Council Social Work Education Committee (JucSWEC)
- Local Government Association (LGA)
- Skills for Care (SfC)
- Social Work England
- UNISON The Public Service Union
- The Adult and Children’s Principal Social Worker Network
- Royal College of Occupational Therapists (RCOT)
- The Principal and Strategic Lead Occupational Therapists National Network (PSLOT)