PAS and the LGA have built a Housing Delivery Test forecasting tool which is aimed at helping officers predict this year and future years HDT measurement. The tool also allows you to see what the HDT measurement will be if a plan becomes over 5yrs old, if minimum local housing need is used or if land supply predictions come true.
Introduction
In 2018, the Local Government Association (LGA) published a HDT model to support planning practitioners in predicting HDT performance and forward planning. This new user guide refers to an updated 2022 version of the HDT model. The new model incorporates changes in government formulae and contains general accessibility and efficiency improvements.

Understanding the HDT measurement
The HDT measurement takes the form of a percentage, alongside a label regarding the status of the HDT result and an action to take place:
- Pass = no action required (HDT >=95%)
- Action plan = action plan needed (HDT < 95%)
- Buffer and action plan = 20% buffer to housing supply is needed in addition to action plan (HDT < 85%)
- Presumption = presumption in favour of sustainable development applies in addition to an action plan and 20% buffer (HDT < 75%)
How to access the HDT model
The model can be accessed here
The formulae
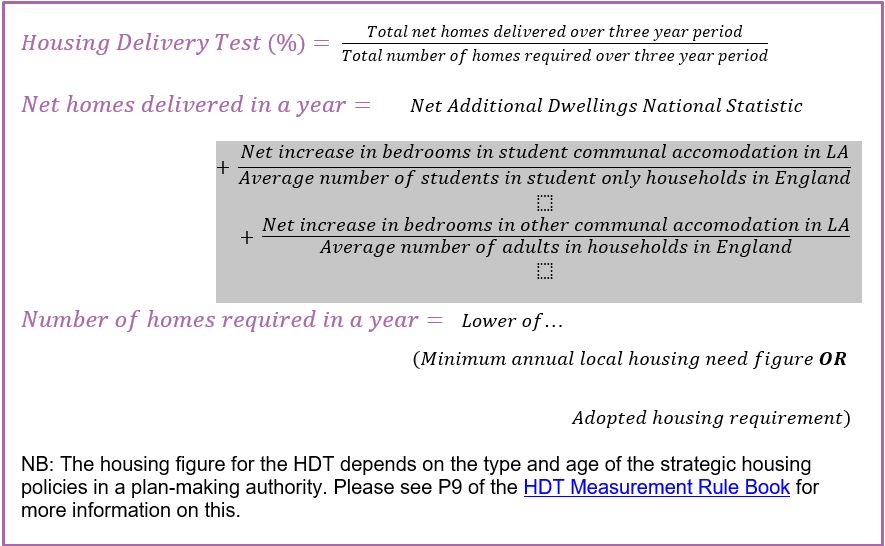
The HDT is a percentage measurement of the number of net homes delivered against the number of net homes required, as set out in the relevant strategic policies for the areas covered by the HDT, over a rolling three-year period.
References
- The HDT 2021 Measurement Technical Note
- The HDT 2018 Measurement Rule Book
- Various data inputs from sources such as Gov.uk, Office for National Statistics etc. Please refer to Annex A for a full list of data inputs.
Abbreviations
| FY | Financial Year |
| HDT | Housing Delivery Test |
| LA | Local Authority |
| LHN | Local Housing Need (Standard Method) |
Caveat and limitations
Please note that this model is based on published data available at the time of the model’s publication (May 2022). As and when new data releases become available, data will need to be updated. Users may wish to edit and change variables contained in this model, which they can do using the sensitivity testing function. This model has been built in consultation with the local government sector, based on the needs of local authorities. Please note that whilst the HDT figures produced are a good estimate, these figures cannot be completely guaranteed and may be subject to a small degree of error.
The HDT Tool
This section contains a step-by-step guide on how to use the HDT tool, by sheet name:
- Dashboard
- Individual LA Sheet
- Calculations (All)
- Sensitivity Test
The Dashboard
What is it?
The dashboard enables the user to quickly view information about the HDT measurements, including the published HDT measurement (2021), projected changes in the HDT measurement over time, homes required, homes delivered, and comparisons between the latest adopted housing requirement and local housing need (LHN). The dashboard also provides the opportunity to carry out some regional benchmarking.
How to use it?
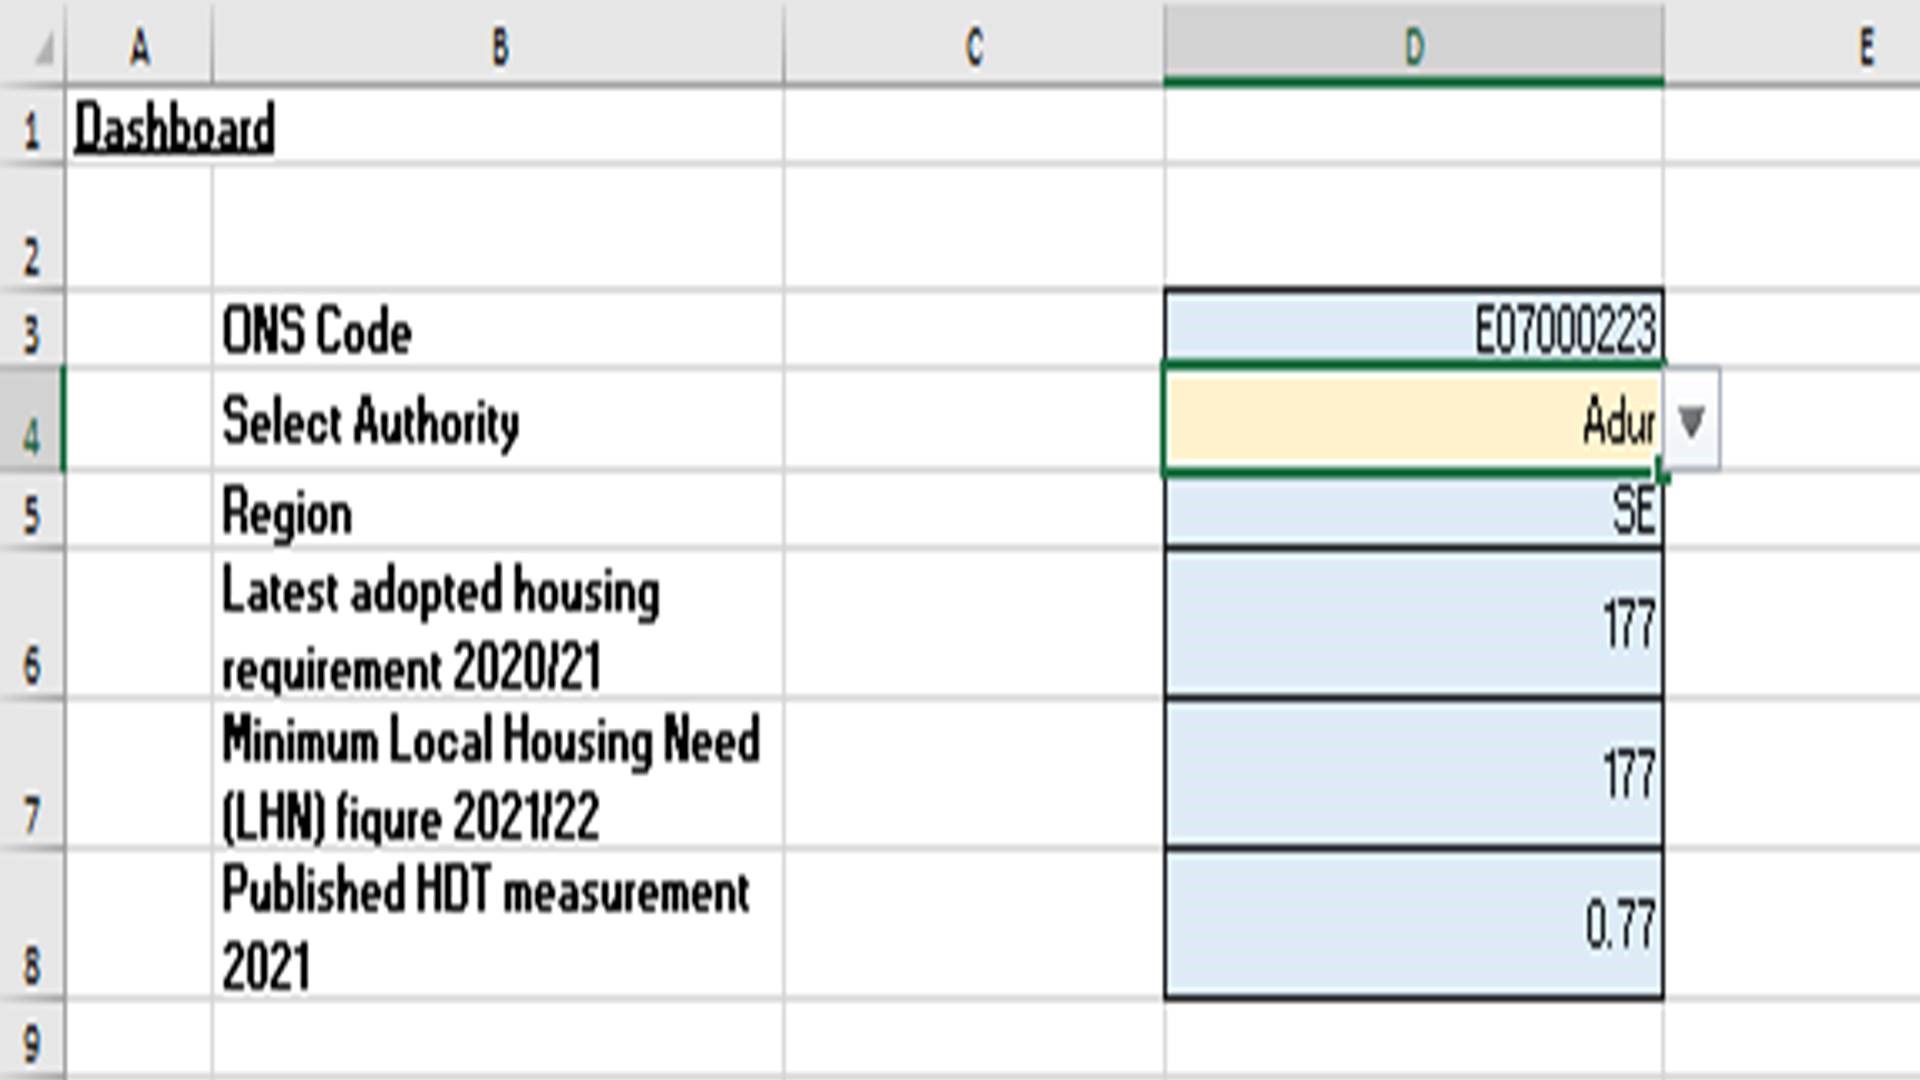
Step 1. Select the local authority (LA) in cell D4 (see Figure 1)
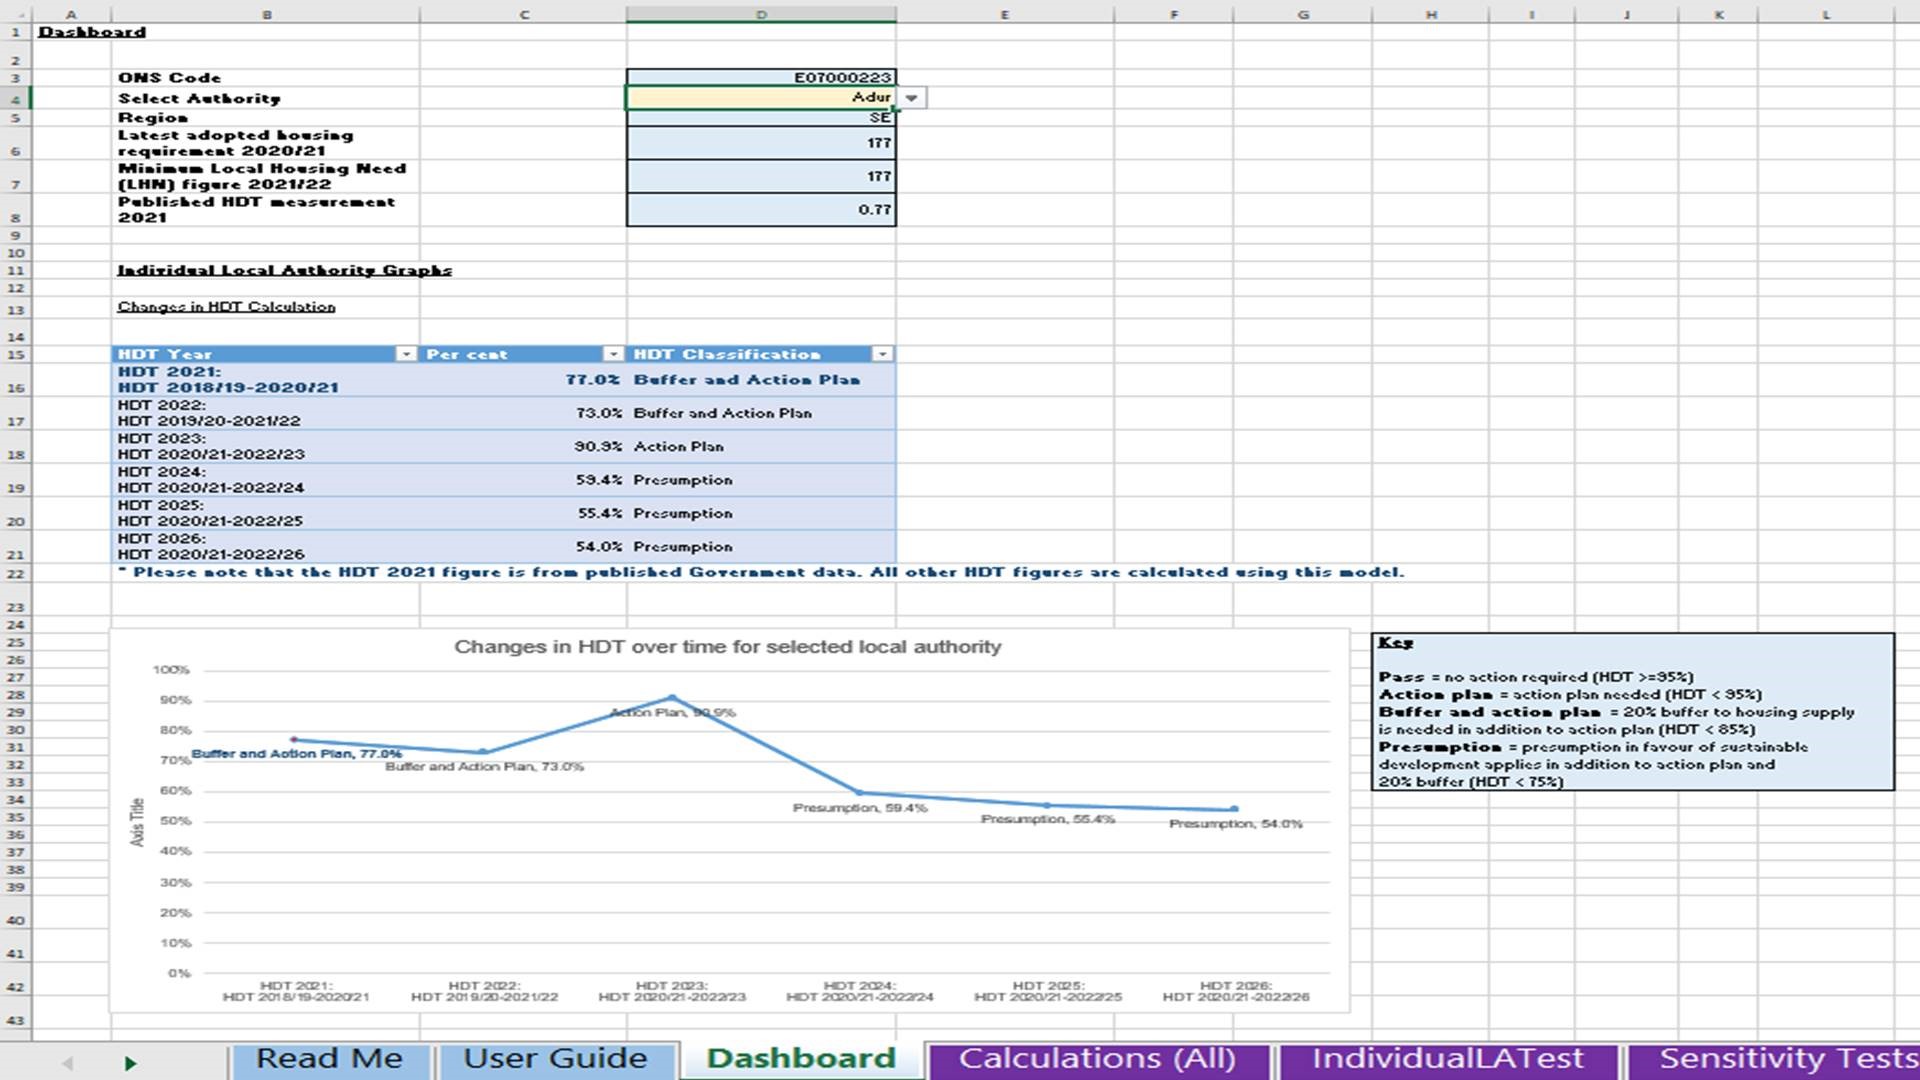
Step 2. Automatically, all the graphs on the sheet will be updated to reflect the chosen local authority (Figure 2).
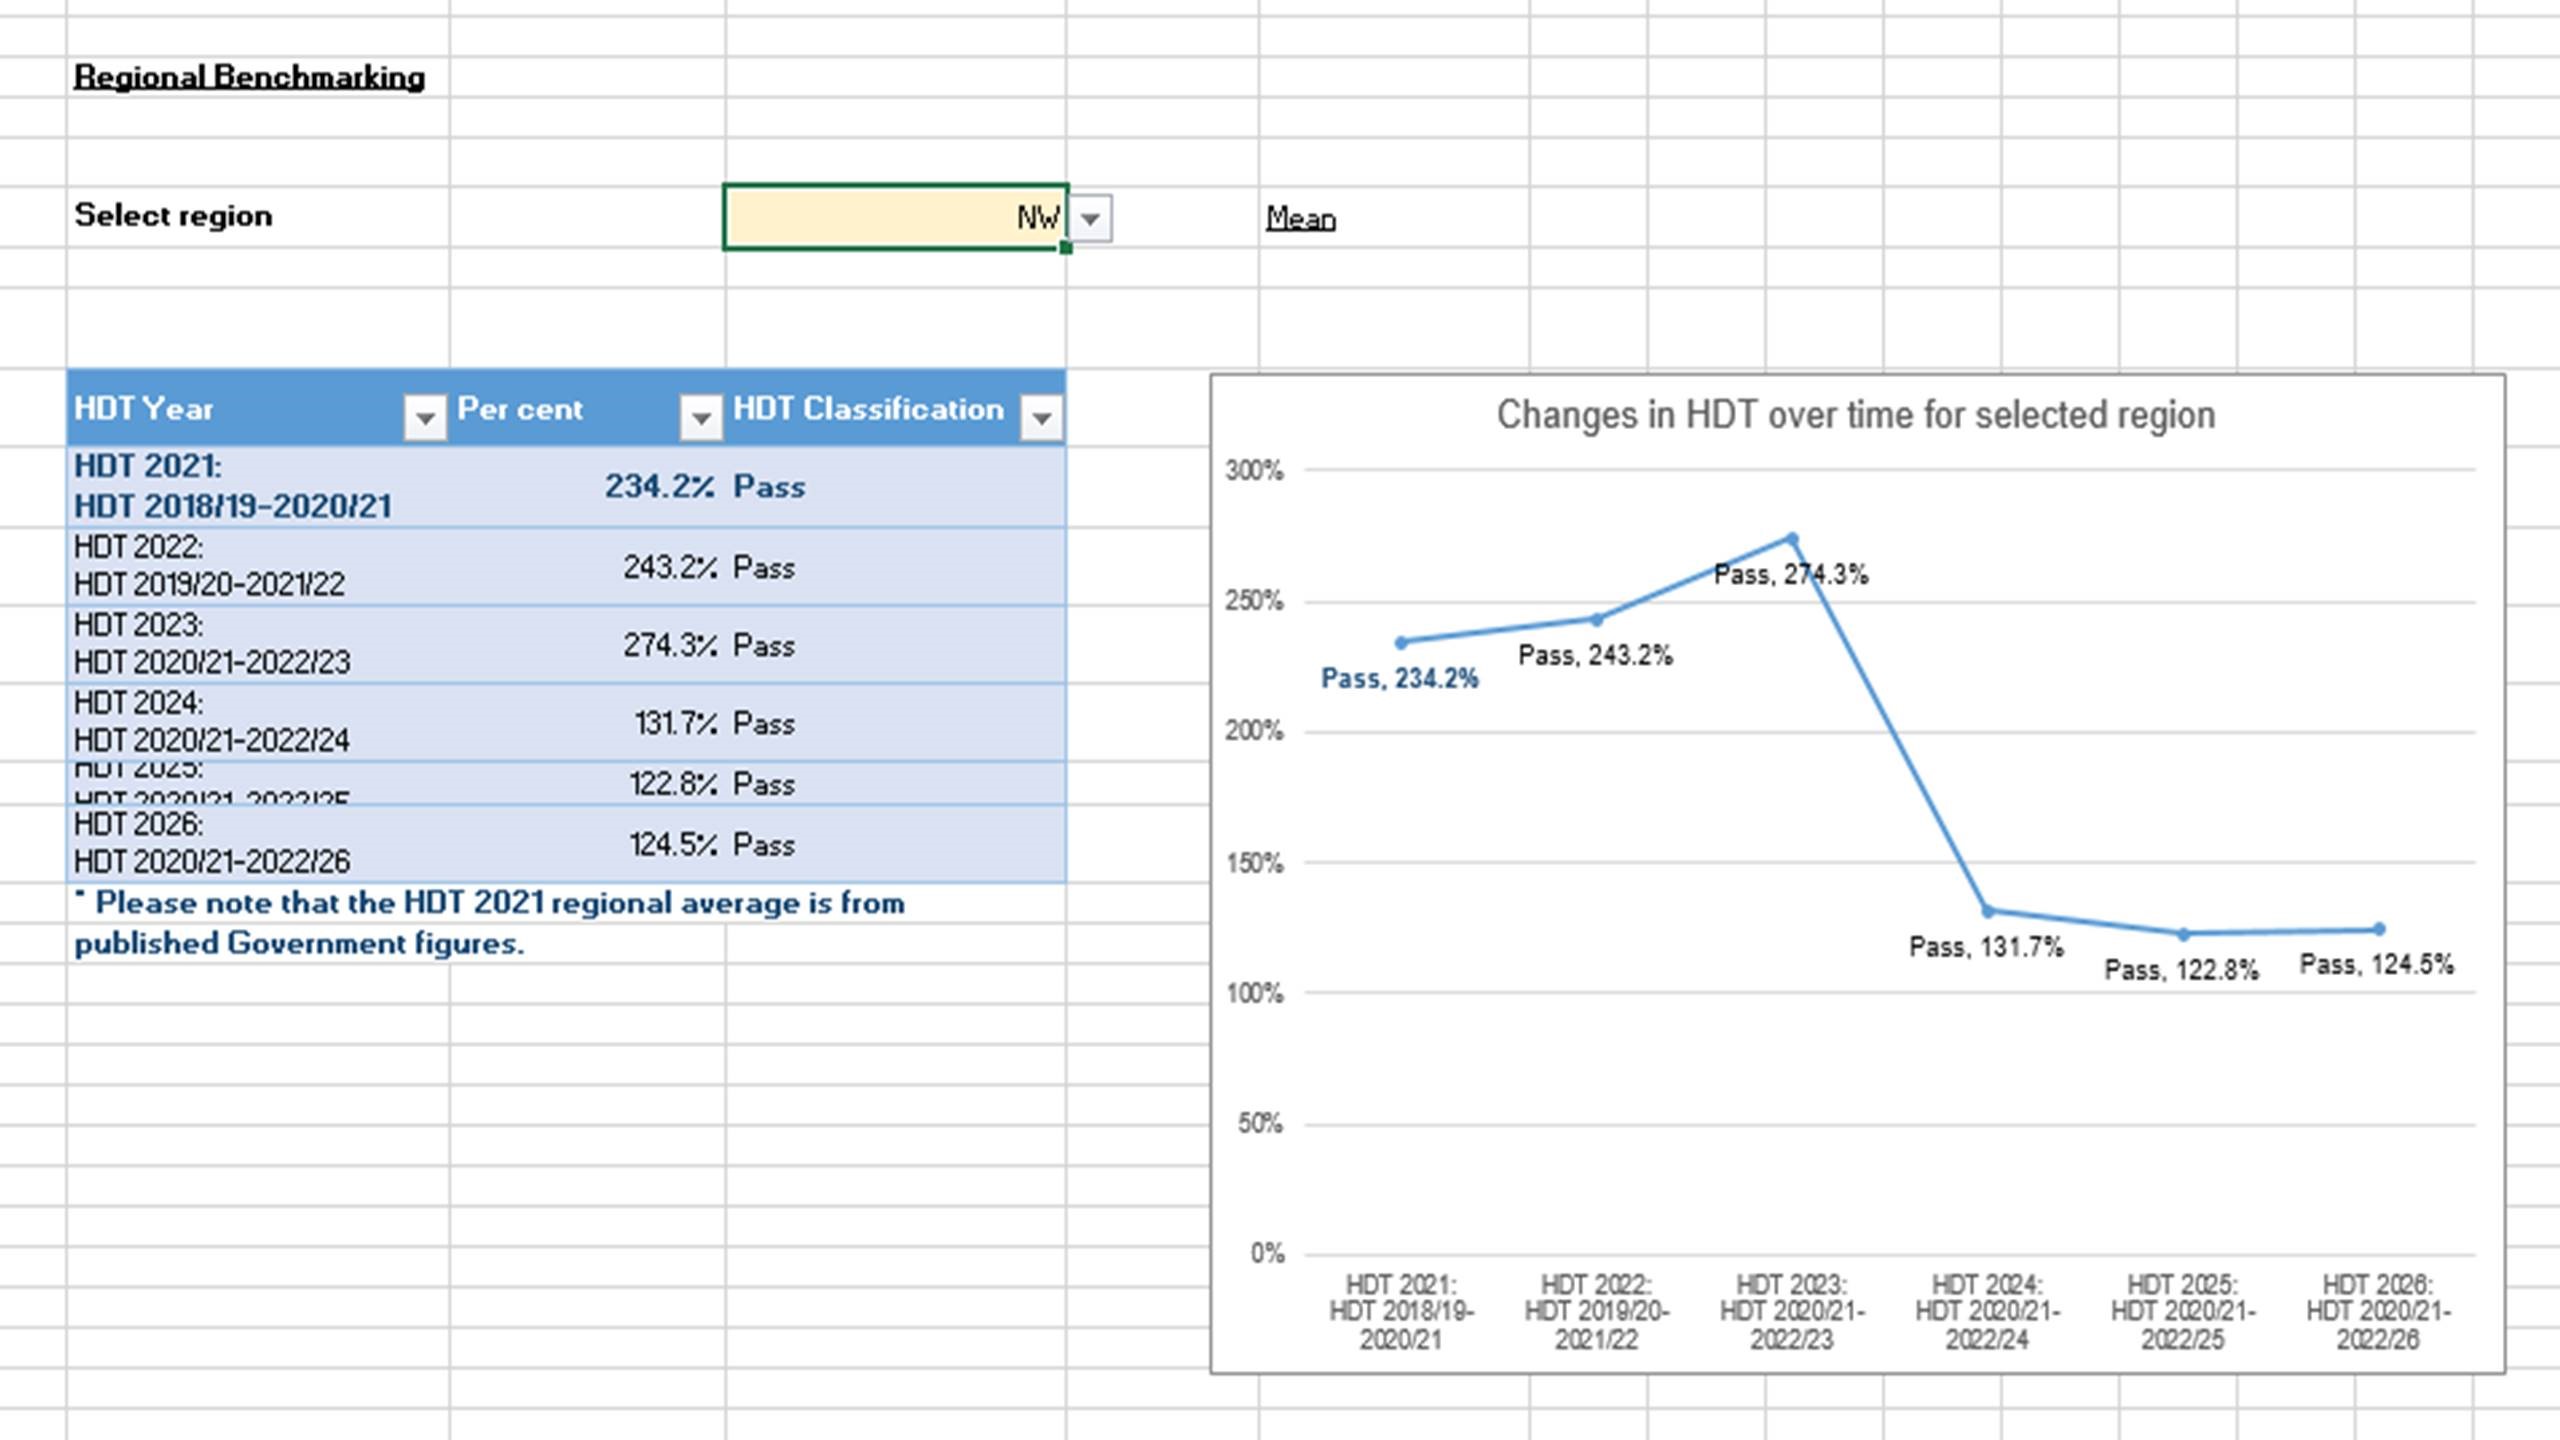
Step 3. Select a region of interest in cell R14 to compare and benchmark the chosen local authority to others. All graphs will automatically update to reflect this region (Figure 3)
Individual local authority tab
What is it?
The Individual LA Test sheet enables a local authority to work out its HDT measurement projections from the financial year (FY) 2021/22 to 2027/28. This calculation is broken down into two parts. Firstly, the tool displays information on the latest adopted housing requirement as per local plan data, checking whether this value was released within the last 5 years compared to the start of the FY. The second part of the calculation works out the minimum LHN figure using the standard method in the Government formulae. The final HDT measurement uses the lower of these two values (i.e., the adopted housing requirement or minimum LHN).
Legend
This sheet has been colour coded so that it is easy to identify the part of the calculation to which the model refers:

How to use it?
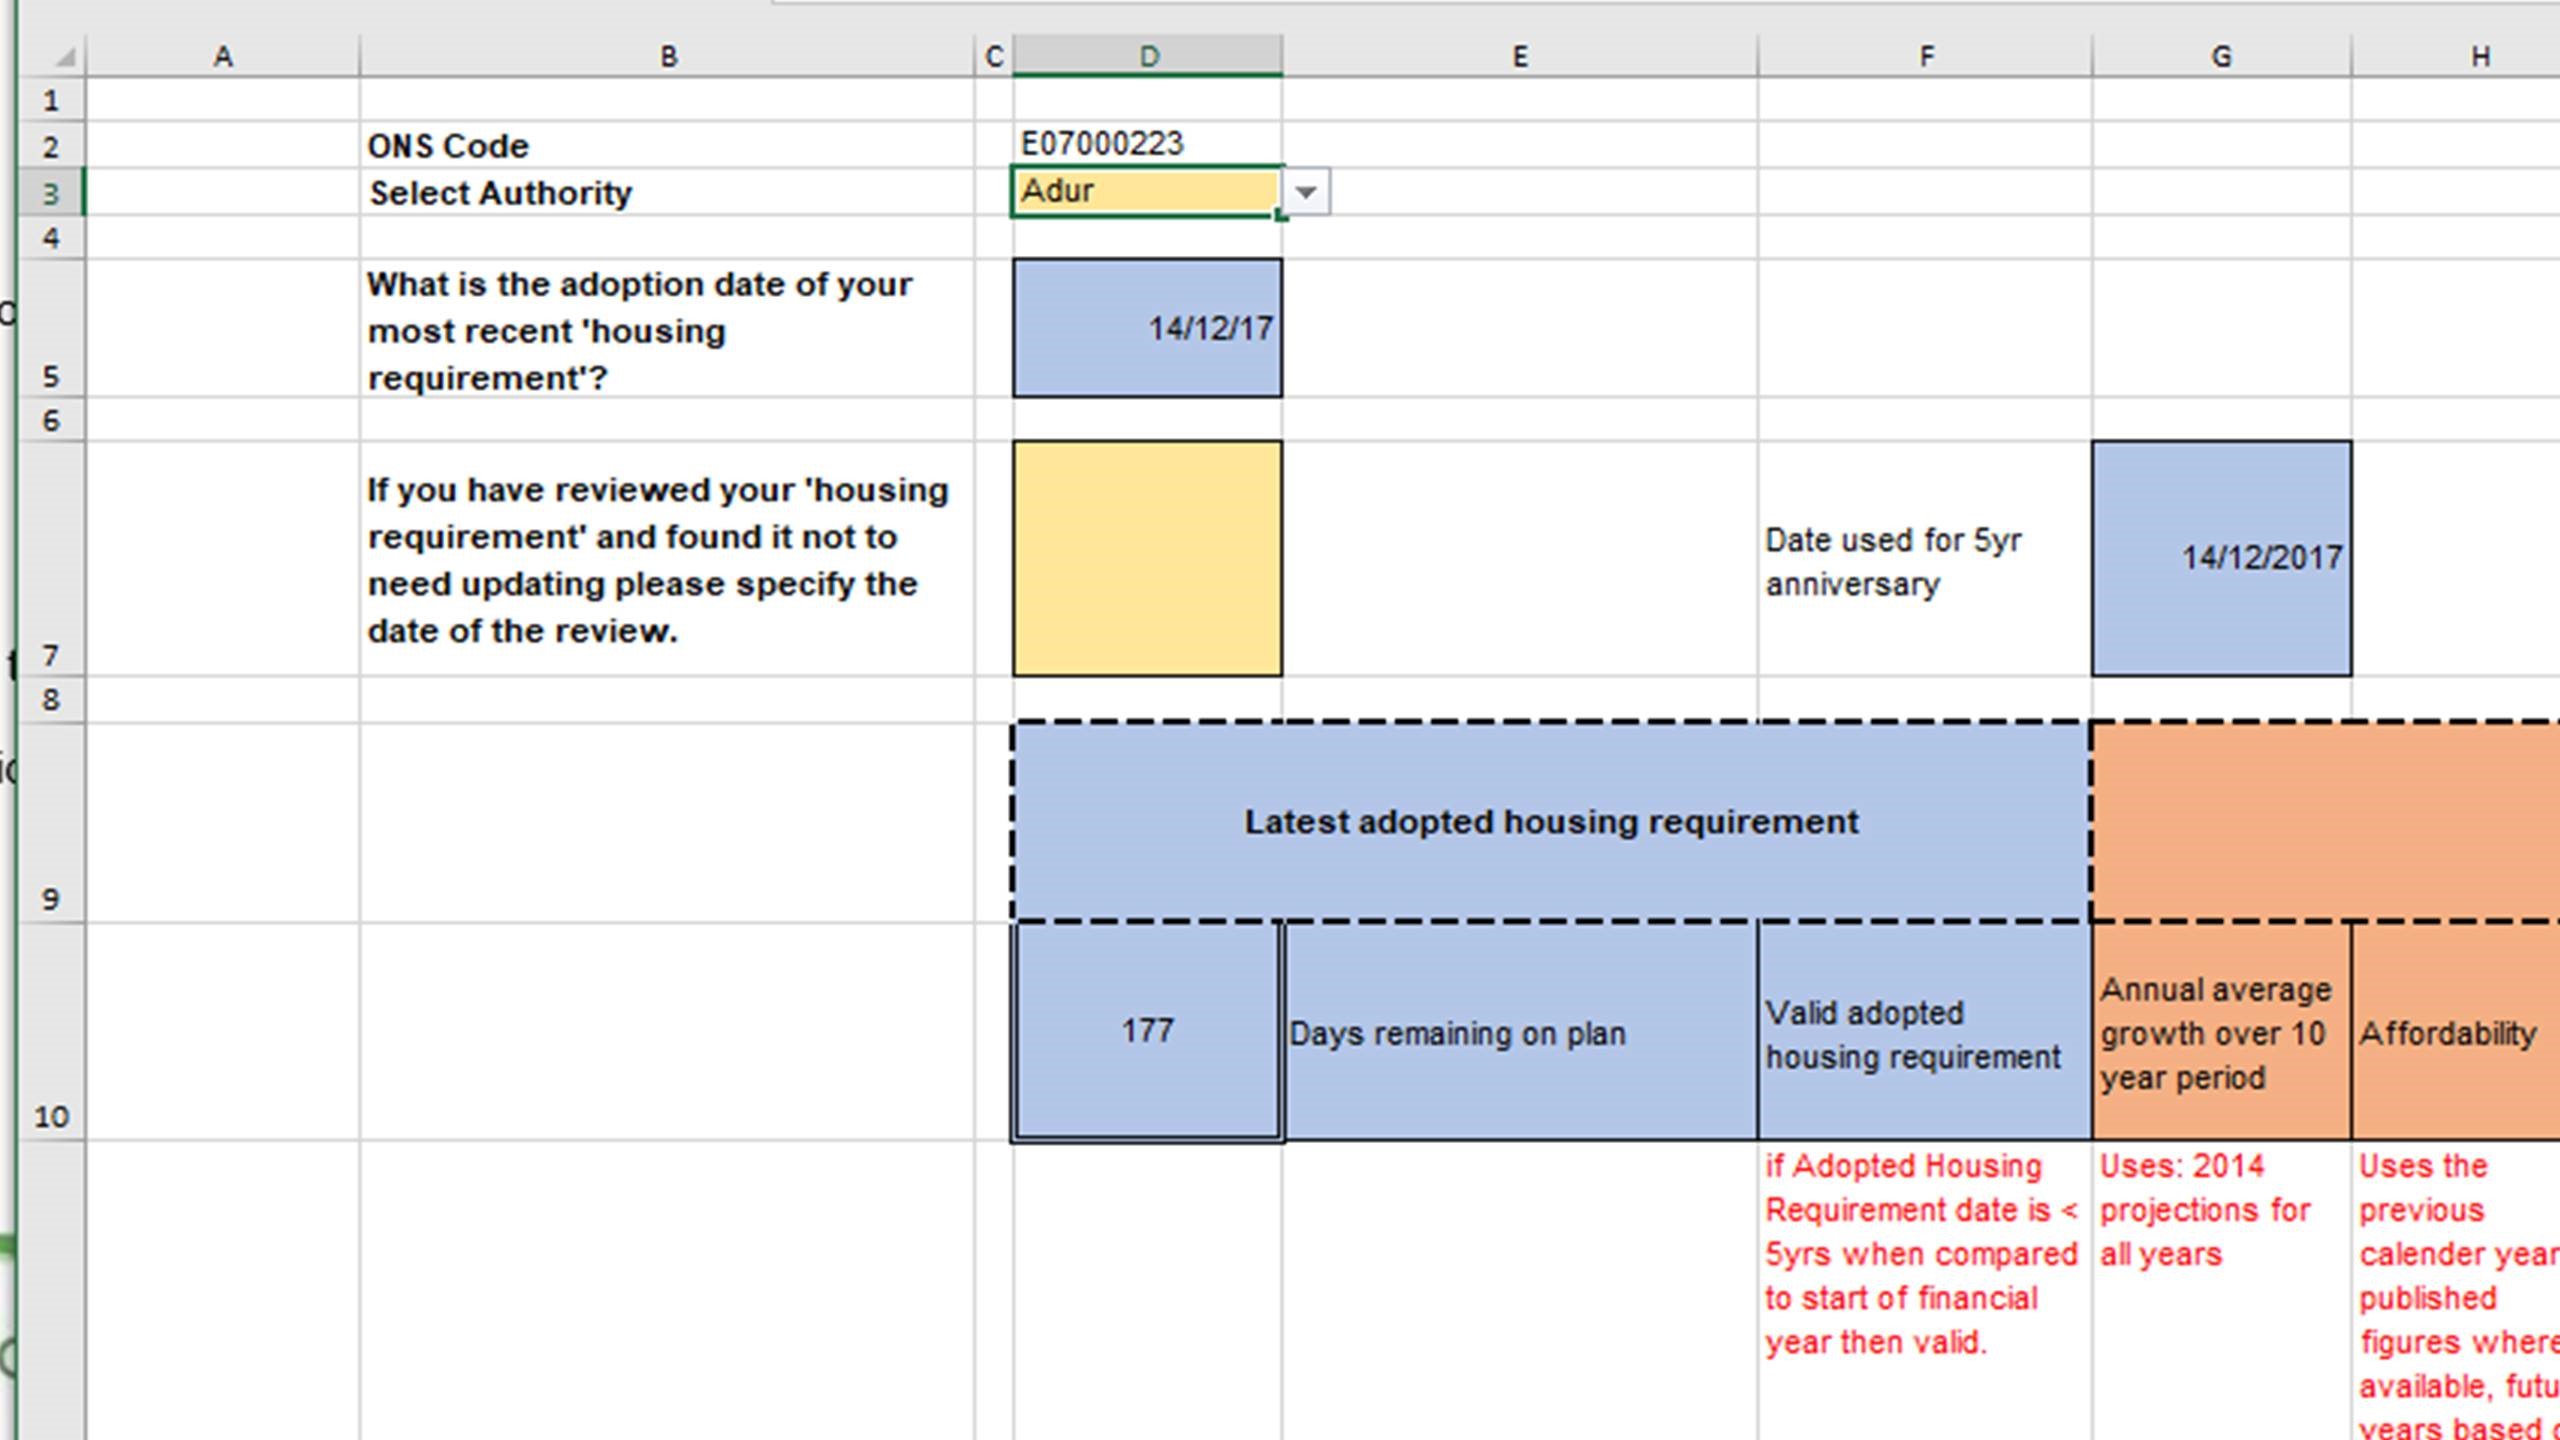
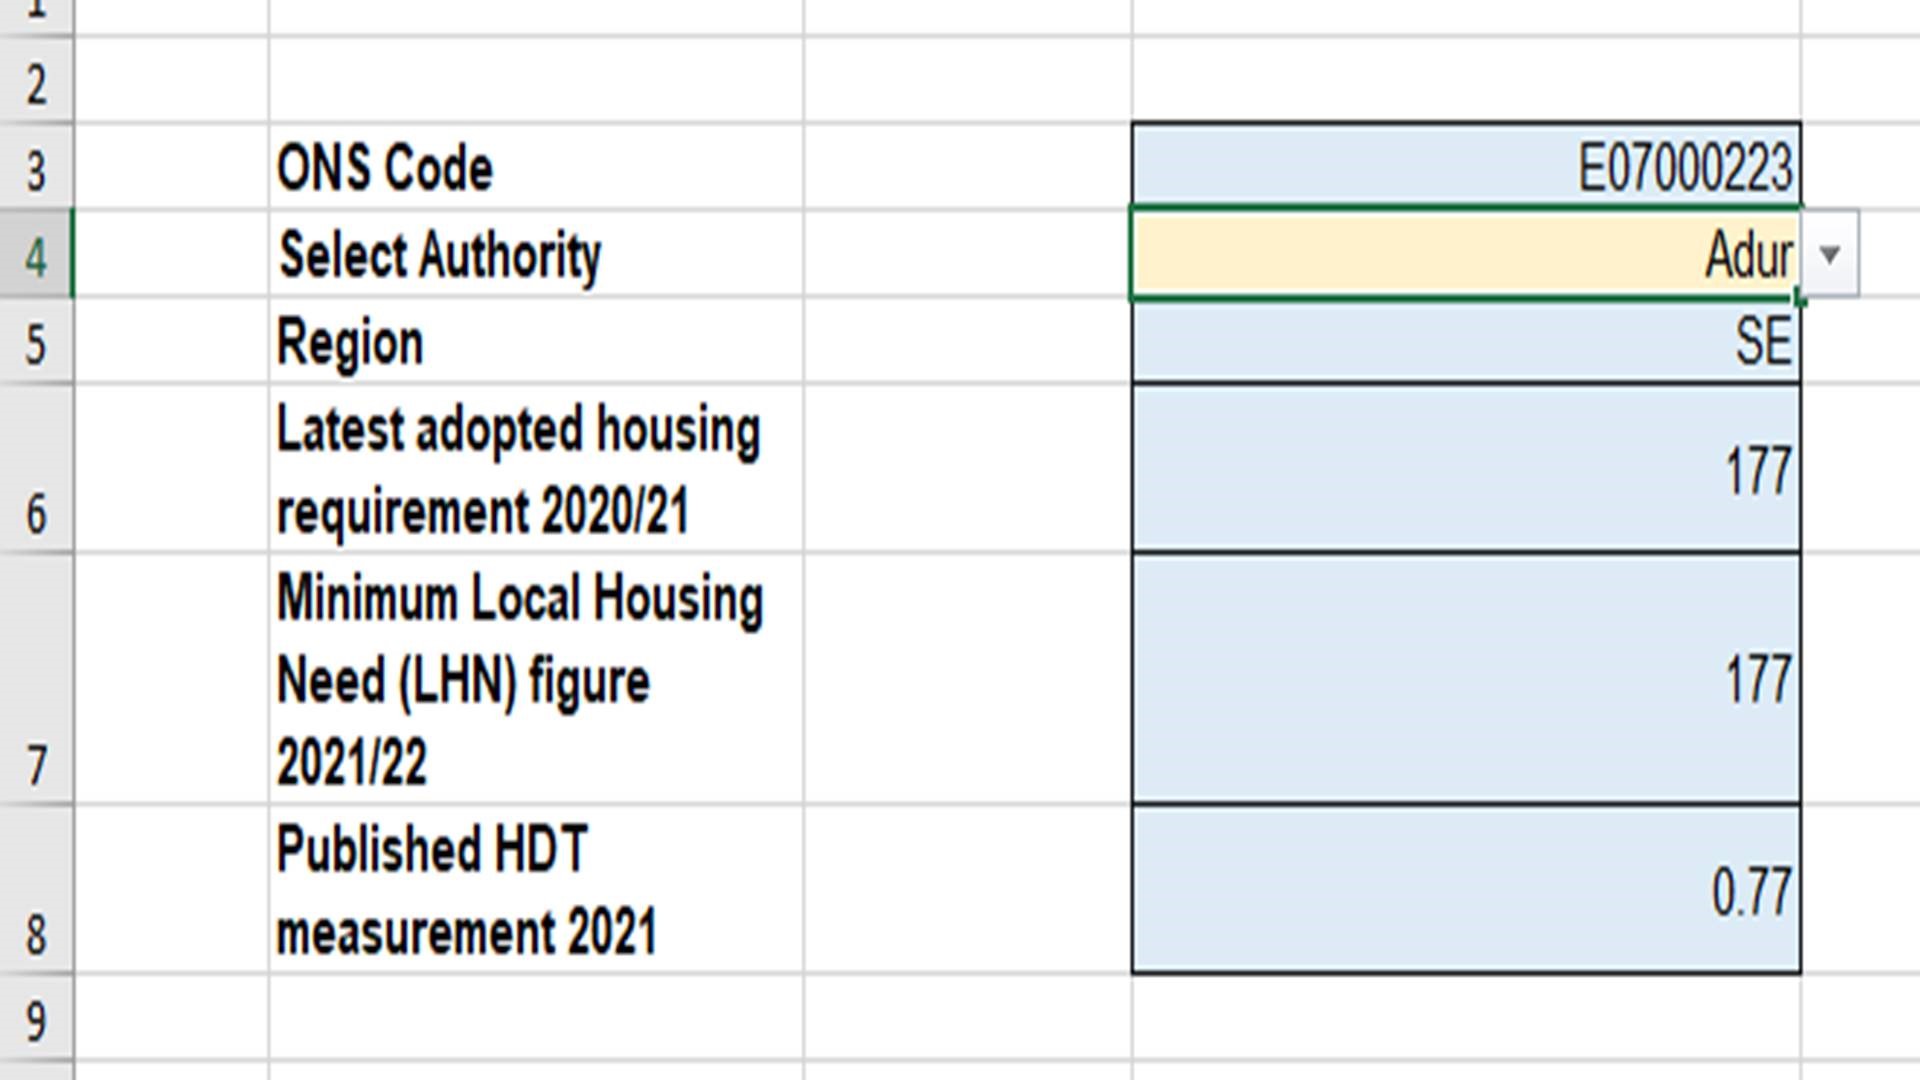
Step 1. In the Individual Test sheet, select authority name in D3 (see Figure 4). This will draw the adoption date of the authority’s most recent ‘housing requirement’ from its local plan in D10. If the user is using this sheet for its own authority, and its ‘housing requirement’ has been reviewed and found not to need updating, specify the date of review in D7.
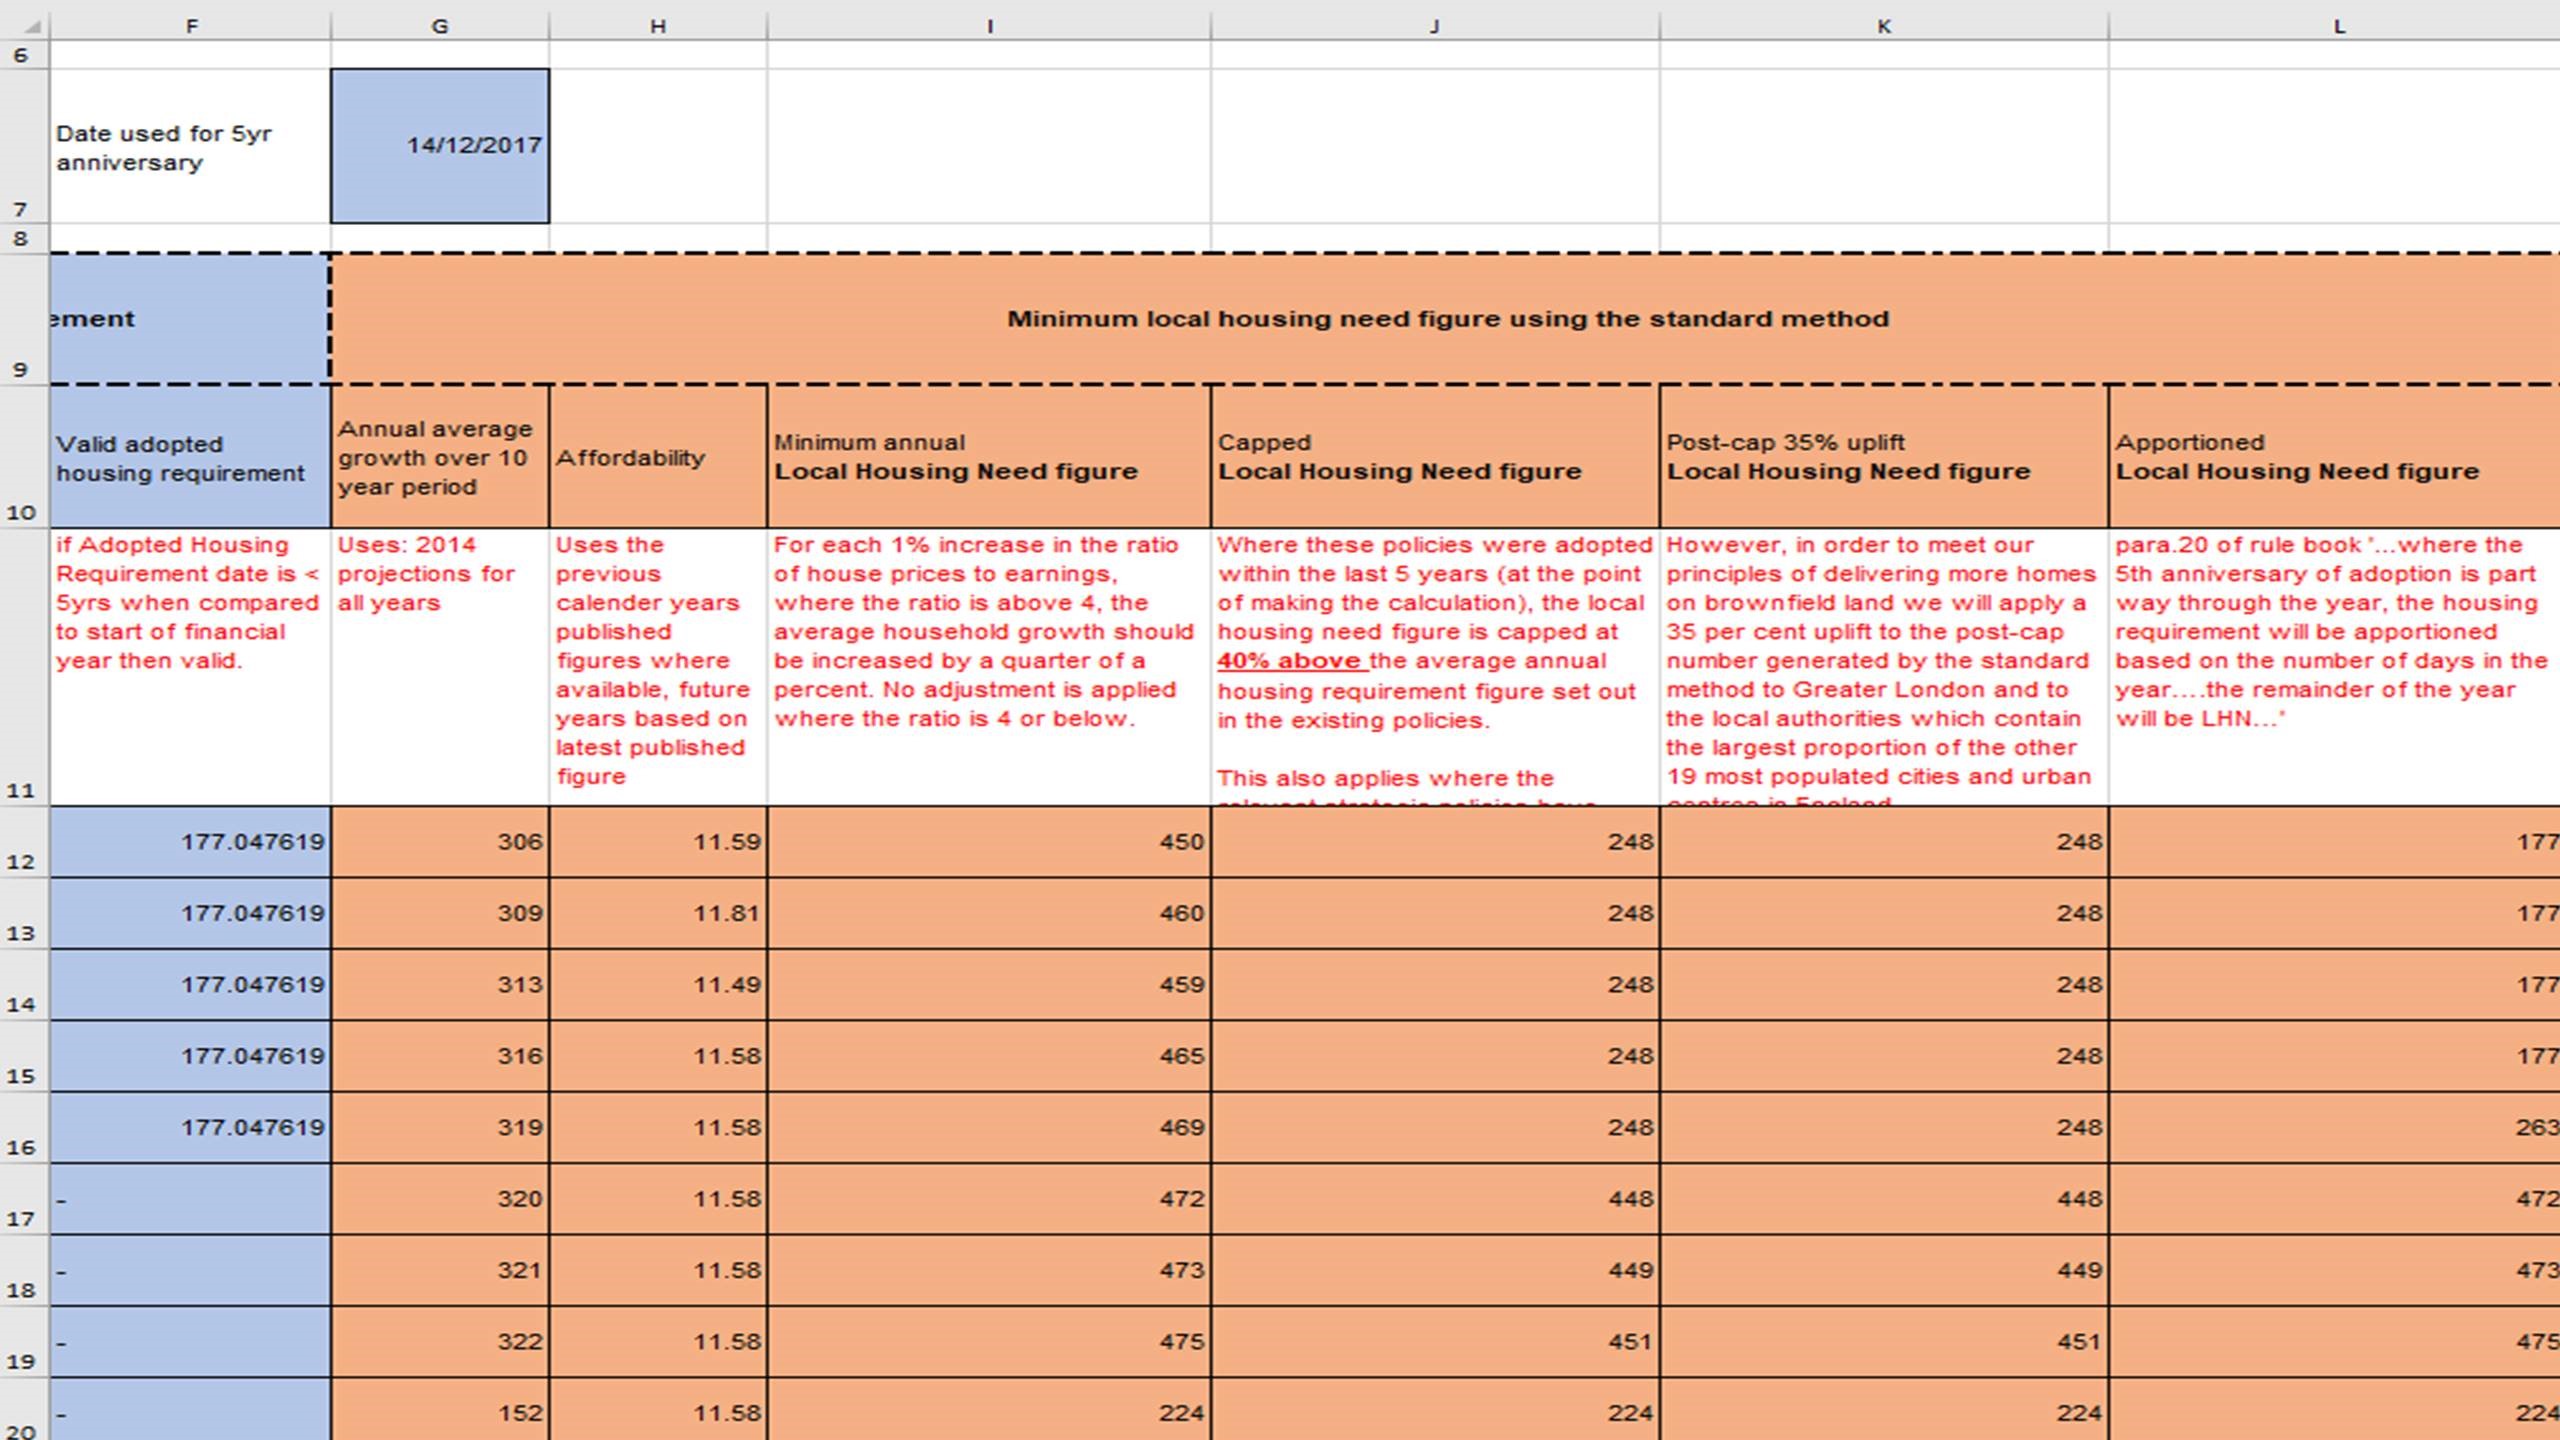
Step 2. Column F uses information on the days remaining on an authority’s most recent local plan to determine whether the adopted housing requirement is valid. If the housing requirement was released less than 5 years before the start of the FY in question, then the requirement is deemed valid.
Step 3. Columns G to L calculate the minimum LHN using the standard method (see Figure 5). Different components needed to calculate the LHN include:
- The projected average annual growth over a 10-year period, based on 2014 housing projections for all test years.
- The affordability ratio.
- Where the policy was adopted in the last 5 years, the LHN is capped at 40% above the average annual housing requirement figure.
- This figure is adjusted for the 35% uplift to major cities and towns for relevant local authorities.
- Then the housing requirement accounts for any local authorities who adopted their plan part way through the year – by apportioning the figure based on the number of days in the year.
Step 4. The final value used in the HDT measurement is the lower of the adopted housing requirement and the minimum LHN. If the adopted housing requirement is more than 5 years old and has not been updated, then the minimum LHN figure is used.
Step 5. The homes required figure is the rolling three-year figure, using the figure from step 4. This is adjusted for updates to the Government policy on Covid-19. For the 2019/20 monitoring year and the 2020/21 monitoring year, there has been a reduction in the period for measurement (column R).
Step 6. The homes delivered figure is the national statistic for net additional dwellings over a rolling three-year period, with adjustments for net student and net other communal accommodation – please enter information where relevant in columns O and P (see Figure 6). Where published data is not available on net additional dwellings, an average of the previous three years is used. Whilst this is the model’s way of predicting delivery rates, please note that local authorities can input their delivery predictions (%YHLS figures) using the sensitivity sheet.
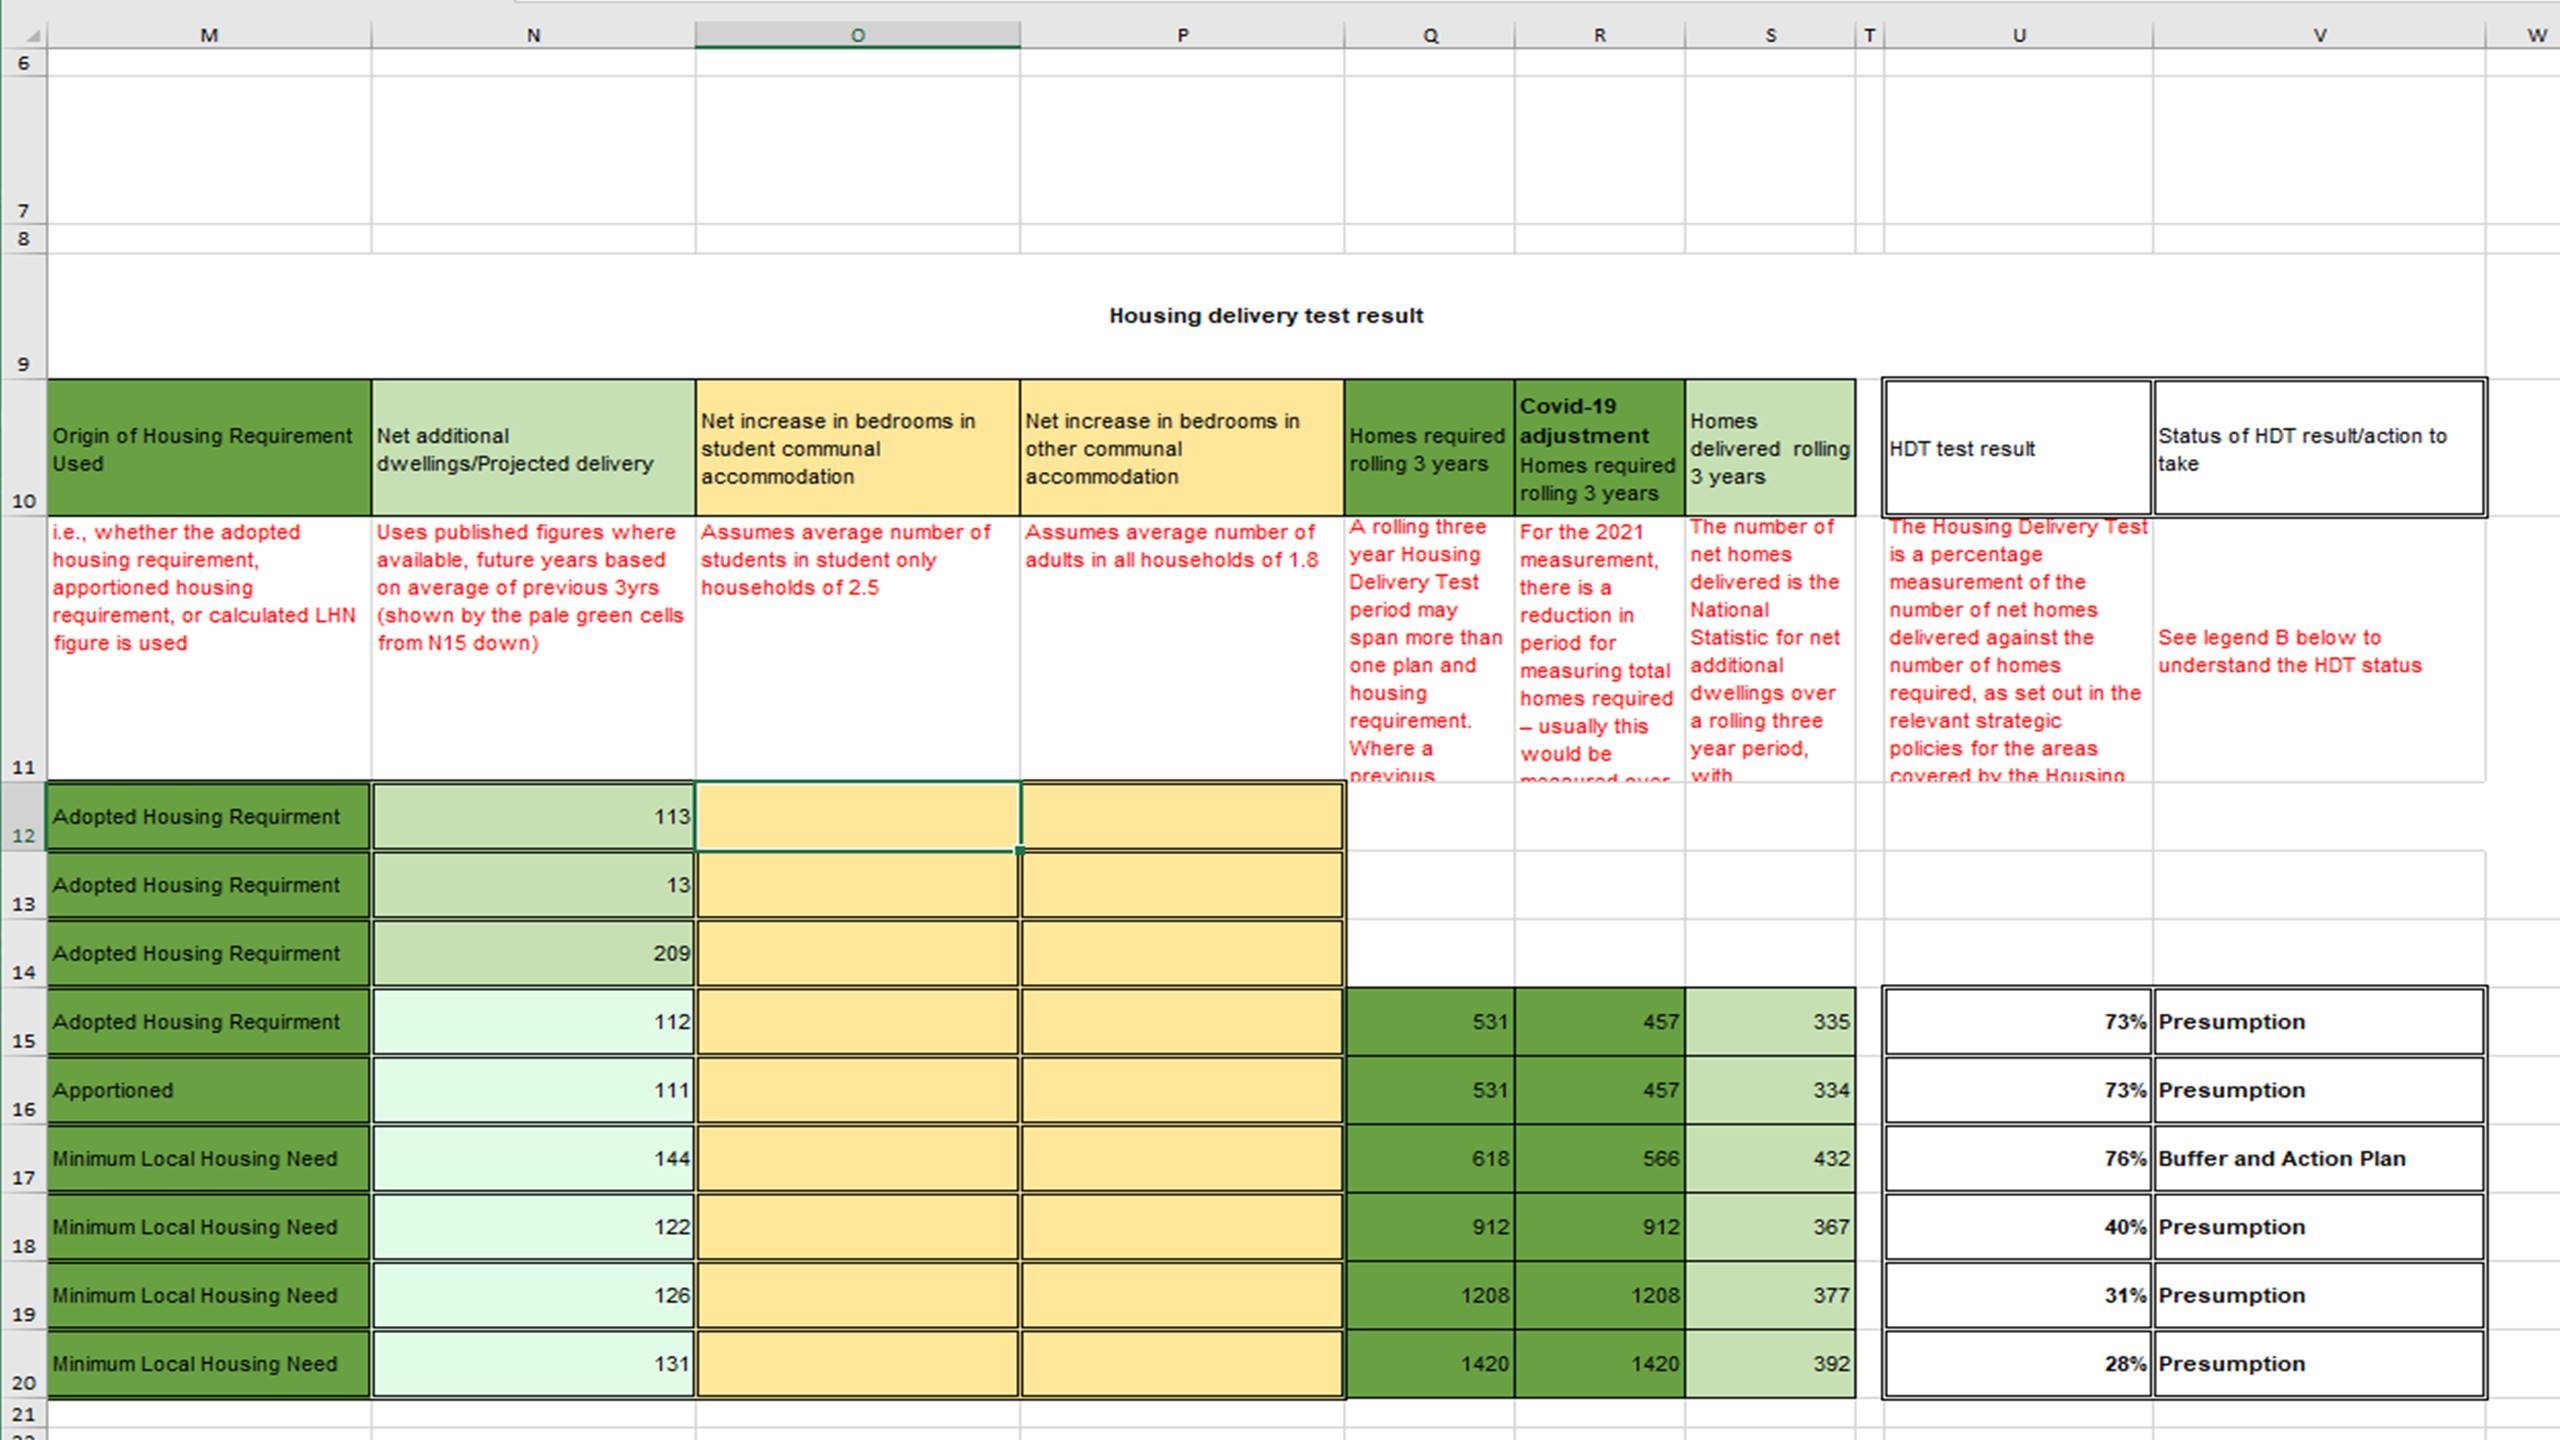
Step 7. The final HDT result is a percentage measurement of the number of net homes delivered against the number of homes required. The status of the HDT result can be seen in column V, next to the percentage.
Calculations All tab
What is it?
The Calculations (All) is an amalgamation of the HDT calculations in the Individual LA Test sheet for every local authority in England. No data inputs can be adjusted on this sheet. However, it may be useful for the user in terms of seeing the HDT results of other local authority and benchmarking their own result against others.
How to use it?
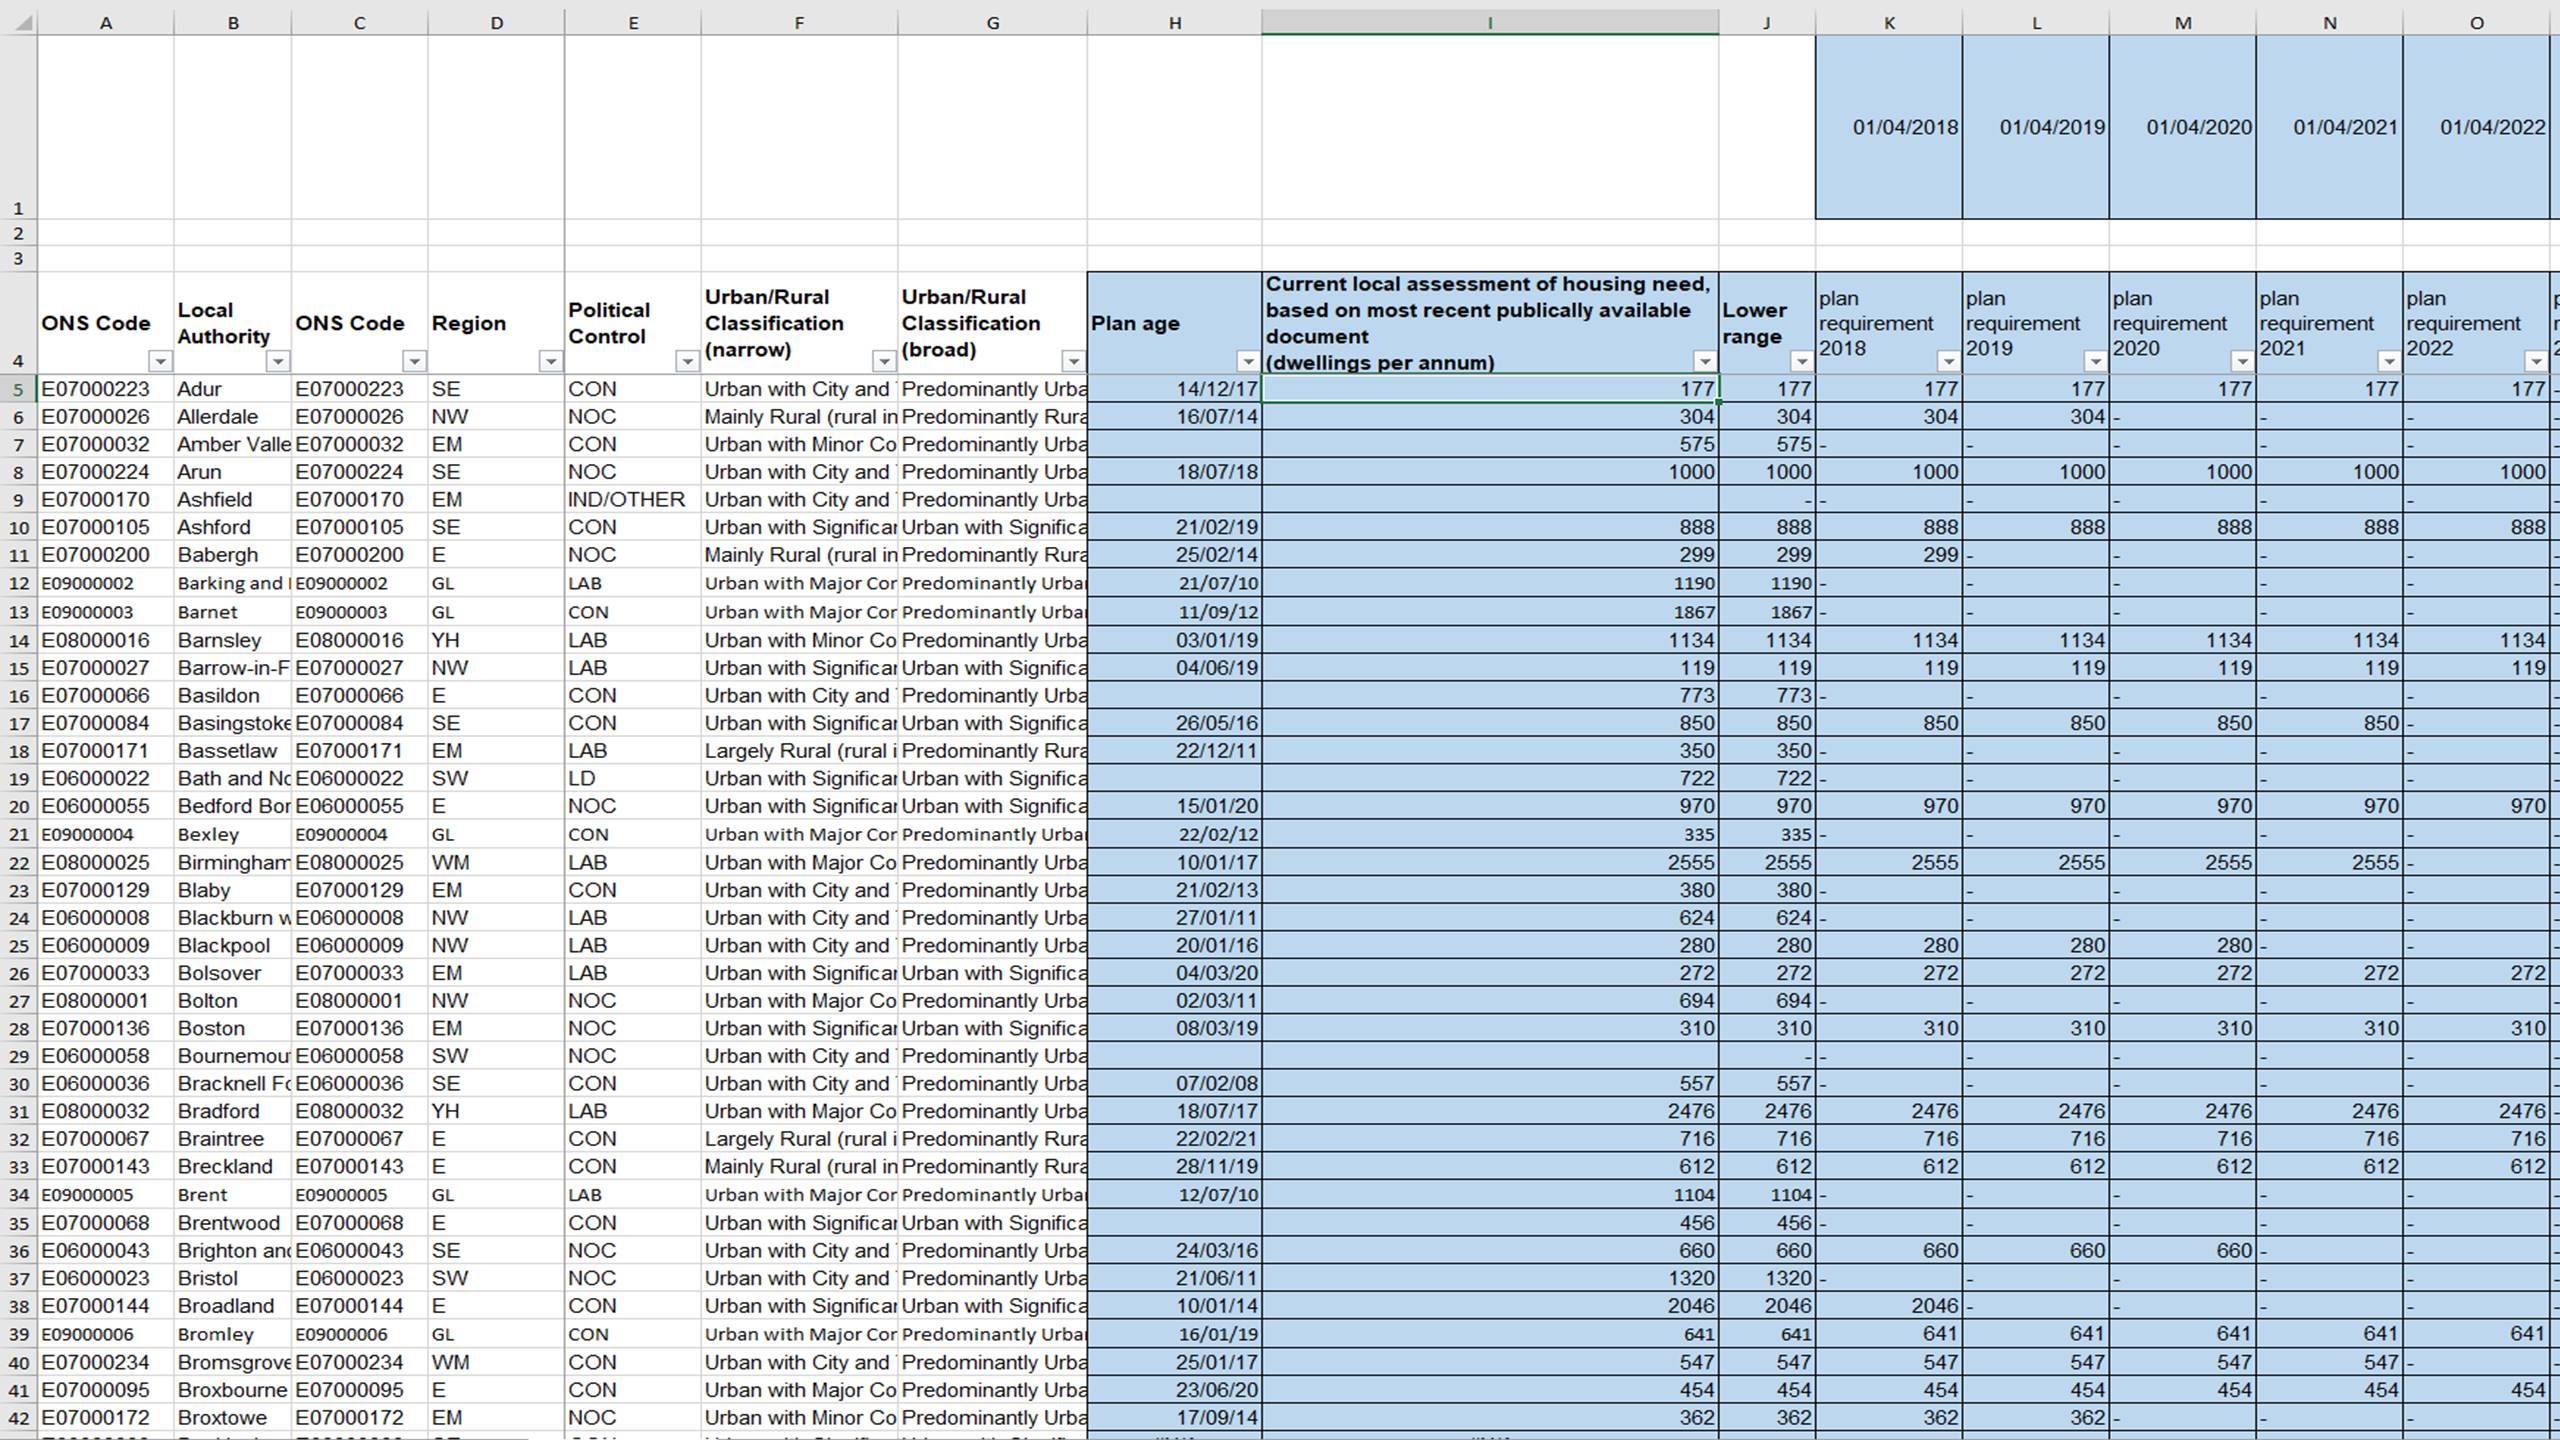
Step 1. View the HDT results of other local authorities by scrolling left and right. Local authorities are listed in alphabetical order in column B.
Step 2. Sort local authorities by region, political control, or urban/rural classification if you are interested in benchmarking against a certain type of local authority (columns D-G in Figure 7).
Sensitivity Testing tab
What is it?
The Sensitivity Test sheet enables the user to adjust some of the inputs used in the HDT calculation to see how the HDT result changes over time. Inputs that can be adjusted include:
- Affordability ratio
- Plan adoption date
- Latest adopted housing requirement
- Net additional dwellings 2021/22
- Net additional dwellings 2022/23
- Net additional dwellings 2023/24
- Net additional dwellings 2024/25
- Net additional dwellings 2025/26
- Net additional dwellings 2027/28
- Year of housing projections dataset
It is intended that this will be useful for forward planning.
Step 1. Select a local authority in cell D4 (see Figure 8). This will bring up the latest adopted housing requirement, the minimum LHN figure (2022) and the published HDT measurement (2021).
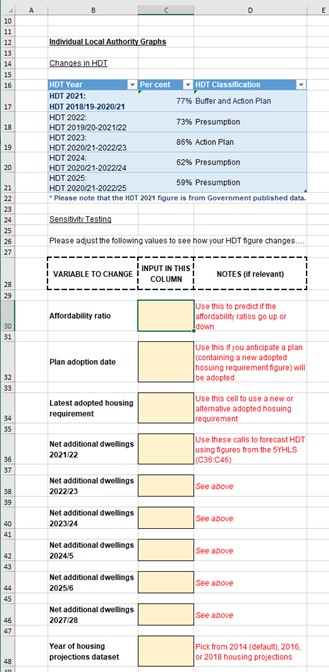
Step 2. In cells C30 to C48, input data points to see how the HDT figures change in the table (see Figure 9). Please note that the first line of the table (row 17) is the published 2021 HDT figure – all rows below are the projected figures as calculated by this model.
This guide has been produced by [email protected] and [email protected].
Annex A: Data Inputs
Sheet Name |
Contents |
Source |
|
Major Cities & Towns |
Data on major cities and towns to inform 35% uplift adjustment (2021) |
|
|
Hshldprojections2018 |
Household projection data (2018) |
|
|
Hshldprojections2016 |
Household projection data (2016) |
|
|
Hshldprojections2014 |
Household projection data (2014) |
|
|
AffordabilityRatio |
Data on affordability ratios (2022) |
|
|
NetAdditions |
Data on net additions (2020/21) |
|
|
local-plan-data |
Local plan data (2020) |
|
|
UrbanRuralClassification |
Data on urban rural classifications (2011) |
|
|
PoliticalControl |
Data on political control (2021) |
LGA (in-house) |
|
HDT 2021 Measurement Results |
HDT published results (2021) |
NB: The most recent data as per April 2022 was used. Data may need to be updated over time as per new releases of datasets and/or updates to the Government methodology for HDT delivery.