Summary
Background
Between September and October 2024, the Local Government Association (LGA) and community safety experts, Resolve, conducted an online survey of all councils in England and Wales, asking them to share their current views on anti-social behaviour (ASB), the challenges they face and possible solutions. This exercise aimed to provide firm evidence for the LGA’s and Resolve’s asks to government. The results from this work will be a crucial part of that evidence. The survey was sent to Heads of Community Safety or equivalent positions, and a total of 126 councils (37 per cent) responded.
Key findings
- Three quarters of councils said changing personnel within partner organisation was a barrier they faced when sharing ASB related information across different organisations.
- Eight out of 10 (80 per cent) councils said that sharing information between stakeholders causes delays in their investigations and taking action against perpetrators to some extent.
- 85 per cent of councils said they would support the implementation of a single national information sharing agreement for ASB data.
- 83 per cent of councils believed very or fairly strongly that housing providers should get full access to community safety partnerships.
- Nine out of 10 (94 per cent) councils thought, to a great or moderate extent, that a closer relationship between housing providers and community safety partner leads to improved outcomes relating to ASB.
Introduction
As leaders of their place and communities, Councils play a leading role in tackling anti-social behaviour (ASB). This role is exercised often in partnership with other agencies as part of Community Safety Partnerships (CSPs). From September to October 2024, the LGA and Resolve conducted an online survey of county councils, unitary councils, metropolitan districts, London boroughs and districts across England and Wales regarding the challenges they face and possible solutions to help with tackling anti-social behaviour.
Methodology
The survey was conducted by the LGA’s Research and Information Team using an online questionnaire. An email containing a unique link was sent to all Heads of Community Safety (or equivalent positions) in all councils in England and Wales (339 in total). The survey was available to complete online between September and October 2024. The final response rate was 37 per cent (126 councils).
This level of response means that these respondents should not necessarily be taken to be widely representative of the views of all councils in England and Wales. Rather, the results are a snapshot of the views of this particular group of respondents.
Response rate
As Table 1 shows, the council type with the highest level of engagement was metropolitan districts, at 50 per cent, or 18 councils. Forty-one per cent, or 35 unitary councils, and 35 per cent, or 58 districts responded to the survey. The lowest level of response was from counties (at 29 per cent or 6 councils) and London Boroughs (at 27 per cent or 9 councils).
Regionally, as shown in Table 2, the highest level of engagement was from councils in the Yorkshire and the Humber region, with a response rate of 67 per cent, or ten councils. This was followed by the East Midlands, with a response rate of 41 per cent, or 16 councils, and Wales at 41 per cent, or nine councils. Councils from the West Midlands had a response rate of 40 per cent, or 13 councils, whilst 39 per cent or 27 councils from the South East responded, and 36 per cent, or 13 councils from the North West responded. From the Eastern region, 34 per cent or 17 councils responded, the North East had a response rate of 33 per cent or four councils, whilst 28 per cent or eight councils from the South West responded. The lowest level of response was from the London region (at 27 per cent or nine councils).
|
Type of council |
Number of questionnaires |
Number of responses |
Response rate |
|---|---|---|---|
| District |
164 |
58 |
35% |
| County |
21 |
6 |
29% |
| London borough |
33 |
9 |
27% |
| Metropolitan district |
36 |
18 |
50% |
| Unitary |
85 |
35 |
41% |
|
Region |
Number of questionnaires |
Number of responses | Response rate |
|---|---|---|---|
| Eastern |
50 |
17 |
34% |
| East Midlands |
39 |
16 |
41% |
| London |
33 |
9 |
27% |
| North East |
12 |
4 |
33% |
| North West |
36 |
13 |
36% |
| South East |
70 |
27 |
39% |
| South West |
29 |
8 |
28% |
| West Midlands |
33 |
13 |
40% |
| Yorkshire and Humber |
15 |
10 |
67% |
| Wales |
22 |
9 |
41% |
To make the results of this survey more representative of councils in England and Wales overall, responses have been weighted.
In addition, the following should be considered when interpreting the findings of this survey:
- Where tables and figures report the base, the description refers to the group of people who were asked the question. The number provided refers to the unweighted number of respondents who answered each question. Please note that bases can vary throughout the survey.
- Throughout the report, percentages may not appear to add up to exactly 100 per cent due to rounding.
Anti-social behaviour
This section contains analysis of the full results from the survey.
Information sharing
Respondents were asked which organisations their council was currently sharing information related to ASB incidents with. As shown in Table 3, 79 per cent of councils were sharing information about ASB incidents with the police, 78 per cent with housing providers and 67 per cent with drug and alcohol services. These were also the top organisations in single-tier and county councils and districts. Eighty-two per cent of single-tier and county councils were sharing ASB – incident information with police and housing providers, whilst in districts a slightly lower percentage - 76 per cent shared with police and 75 per cent with housing providers.
|
|
Total Per cent |
Districts Per cent |
Single-tier and counties Per cent |
|---|---|---|---|
| Police |
79% |
76% |
82% |
| Housing providers |
78% |
75% |
82% |
| Drug and alcohol services |
67% |
66% |
69% |
| Health services |
63% |
62% |
64% |
| Probation services |
62% |
57% |
66% |
| Multi-agency risk assessment conference (MARAC) |
61% |
53% |
69% |
| Fire and Rescue Services |
60% |
58% |
62% |
| Education authorities |
58% |
56% |
59% |
| Government |
48% |
49% |
48% |
| Other |
18% |
20% |
17% |
| None of the above |
1% |
0% |
3% |
Unweighted base: all respondents (125)
Twenty-three councils stated ‘Others’ they share data with. This included a range of organisations that are mentioned below:
- other agencies, third sector and partners
- victim support organisations
- violence reduction
- organisations covered by their Community Safety Partnership agreement
- youth teams
- Local government
Respondents were then asked which organisations they received information about ASB incidents from. As shown in Table 4, nearly all (99 per cent) of respondents received information from police, 91 per cent from housing providers and 60 per cent from fire and rescue services. When the data was broken down by council type similar responses were shown. A slightly higher percentage (68 per cent) of districts said they received information from fire and rescue services compared to single-tier and counties (53 per cent).
|
|
Total Per cent |
Districts Per cent |
Single-tier and counties Per cent |
|---|---|---|---|
| Police |
99% |
98% |
99% |
| Housing providers |
91% |
91% |
91% |
| Fire and Rescue Services |
60% |
68% |
53% |
| Education authorities |
54% |
61% |
49% |
| Multi-agency risk assessment conference (MARAC) |
51% |
49% |
52% |
| Drug and alcohol services |
49% |
50% |
48% |
| Health services |
42% |
46% |
40% |
| Probation services |
35% |
40% |
31% |
| Government |
27% |
32% |
22% |
| Other |
22% |
24% |
21% |
| None of the above |
1% |
2% |
0% |
Unweighted base: all respondents (125)
Twenty-five councils stated ‘Others’ they receive data from. These responses were varied, including:
- youth Services
- other agencies/third sector/partners
- town and parish councils and local environmental health
- multi-agency ASB approaches.
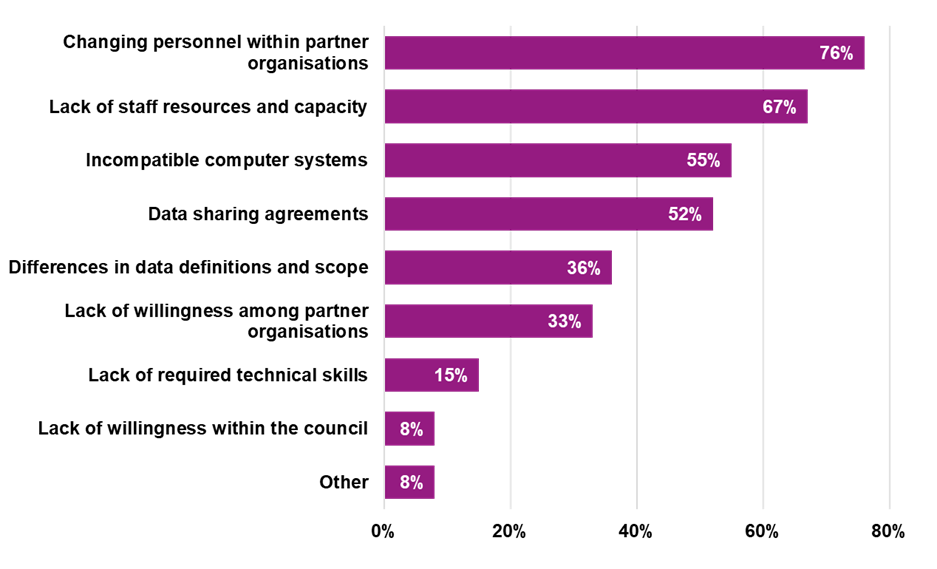
Respondents were asked what barriers, if any, they faced when sharing ASB-related information across different organisations. As shown in Table 5, the most common response provided by three quarters (76 per cent) of councils was changing personnel within partner organisations. Two thirds (67 per cent) of councils said lack of staff resources and capacity and 55 per cent said incompatible computer systems. When the data was broken down by council type, these were also the top three reasons given. In districts a larger proportion of councils (73 per cent) said that lack of staff resources and capacity was a barrier compared to 61 per cent of single-tier and county councils reporting this.
|
|
Total Per cent |
Districts Per cent |
Single-tier and counties Per cent |
|---|---|---|---|
| Changing personnel within partner organisations |
76% |
77% |
76% |
| Lack of staff resources and capacity |
67% |
73% |
61% |
| Incompatible computer systems |
55% |
53% |
58% |
| Data sharing agreements |
52% |
54% |
50% |
| Differences in data definitions and scope |
36% |
36% |
35% |
| Lack of willingness among partner organisations |
33% |
35% |
31% |
| Lack of required technical skills |
15% |
25% |
5% |
| Lack of willingness within the council |
8% |
8% |
7% |
| Other |
10% |
11% |
9% |
Unweighted base: all respondents (125)
Respondents were asked if they had one or more signed information sharing agreements in place with partner organisations. As shown in Table 6, nearly all councils (93 per cent) said that they had a data sharing agreement, 4 per cent said they didn’t and 3 per cent were unsure.
|
|
Total Per cent |
Districts Per cent |
Single-tier and counties Per cent |
|---|---|---|---|
| Yes |
93% |
99% |
89% |
| No |
4% |
1% |
6% |
| Don’t know |
3% |
0% |
5% |
Unweighted base: all respondents (125)
Those councils that did have an information sharing agreement were asked which stakeholders they have a signed information sharing agreement in place with. As shown in Table 7, the majority (96 per cent) of councils have an information sharing agreement with police, this was also the same in districts (95 per cent) and single-tier and counties (97 percent). Seventy per cent of councils have an agreement with fire and rescue and 69 per cent with housing providers.
When the responses are broken down by council type, differences are observed– in districts 76 per cent said fire and rescue and 71 per cent said health services. In single-tier and counties, three-quarters (75 per cent) have an agreement with MARAC – compared to 60 per cent of districts. Sixty-eight per cent of single-tier and counties have an agreement with housing providers.
|
|
Total Per cent |
Districts Per cent |
Single-tier and counties Per cent |
|---|---|---|---|
| Police |
96% |
95% |
97% |
| Fire and Rescue Services |
70% |
76% |
64% |
| Housing providers |
69% |
70% |
68% |
| Probation services |
68% |
73% |
62% |
| MARAC |
68% |
60% |
75% |
| Health services |
66% |
71% |
61% |
| Drug and alcohol services |
54% |
57% |
50% |
| Education authorities |
45% |
50% |
40% |
| Other |
15% |
15% |
16% |
Unweighted base: all respondents (117)
There were sixteen councils that said they had agreements with other organisations, these were:
- multi-agency agreements
- with their county council, or vice versa
- crime partnerships
- third sector organisations
- youth justice
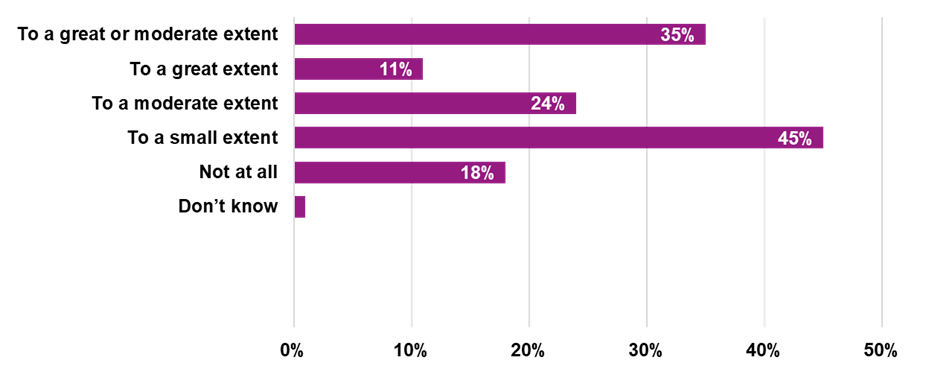
Councils were asked to what extent does sharing information between stakeholders cause delays in their investigations and taking actions against perpetrators. As shown in Table 8, eight out of ten (80 per cent) of councils said sharing information between stakeholders causes delays to a great or moderate extent. This figure was similar when the data is broken down by type of council, however, when looking at to a great extent and to a moderate separately it is a little different. Among districts, 14 per cent of councils said they felt this to a great extent, whilst only 8 per cent of single-tier and county councils felt this. Thirty-one per cent of single-tier and county councils felt this to a moderate extent, compared to 18 per cent of districts. Around a half (49 per cent) of district councils said they felt this to a small extent, compared to 42 per cent of single-tier and county councils.
|
|
Total Per cent |
Districts Per cent |
Single-tier and counties Per cent |
|---|---|---|---|
| To a great or moderate extent |
35% |
32% |
39% |
| To a great extent |
11% |
14% |
8% |
| To a moderate extent |
24% |
18% |
31% |
| To a small extent |
45% |
49% |
42% |
| Not at all |
18% |
20% |
16% |
| Don’t know |
1% |
0% |
3% |
Unweighted base: all respondents (117)
Respondents were asked if their council would support the implementation of a single national information sharing agreement for ASB data. As can be seen in Table 9, 85 per cent of councils said they would support this, 3 per cent said they would not, and 12 per cent said ‘don’t know’.
|
|
Total Per cent |
Districts Per cent |
Single-tier and counties Per cent |
|---|---|---|---|
| Yes |
85% |
86% |
84% |
| No |
3% |
1% |
5% |
| Don’t know |
12% |
12% |
11% |
Unweighted base: all respondents (125)
Access to housing providers to Community Safety Partnerships (CSPs)
Councils were asked to what extent are housing providers in their area currently involved in CSPs. As can be seen in Table 10, just over half (55 per cent) of respondents said housing providers in their area were involved in CSPs to a great or moderate extent. Similar findings were shown when the data was broken down by type of council – apart from those that said not at all. Eleven per cent of districts said housing providers were not at all involved, whilst only 5 per cent of single-tier and county councils said this.
|
|
Total Per cent |
Districts Per cent |
Single-tier and counties Per cent |
|---|---|---|---|
| To a great or moderate extent |
55% |
53% |
56% |
| To a great extent |
17% |
15% |
18% |
| To a moderate extent |
38% |
38% |
38% |
| To a small extent |
33% |
36% |
31% |
| Not at all |
8% |
11% |
5% |
| Don’t know |
4% |
0% |
9% |
Unweighted base: all respondents (125)
Councils were asked how strongly they believed housing providers should have full access to CSPs. As shown in Table 11, 83 per cent of councils believed very or fairly strongly that housing providers should get full access to CSPs. When the data is broken down by type of council, 86 per cent of districts and 81 per cent of single-tier and county councils believed this. Four per cent of districts believed not very strongly, and a further 4 per cent said not at all strongly – compared to 9 per cent of single-tier and county councils answered not very strongly, and no councils answering not at all strongly.
|
|
Total Per cent |
Districts Per cent |
Single-tier and counties Per cent |
|---|---|---|---|
| Very or fairly strongly |
83% |
86% |
81% |
| Very strongly |
43% |
44% |
42% |
| Fairly strongly |
40% |
42% |
39% |
| Not very strongly |
7% |
4% |
9% |
| Not at all strongly |
2% |
4% |
0% |
| Don’t know |
8% |
6% |
10% |
Unweighted base: all respondents (125)
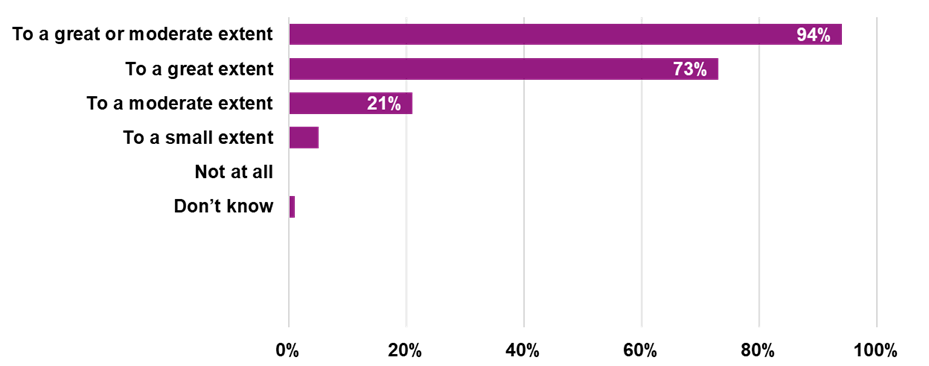
Councils were asked to what extent they thought a closer relationship between housing providers and CSPs leads to improved outcomes relating to ASB. As can be seen in Table 12, 94 per cent of councils answered they thought this to a great or moderate extent. When looking at the data broken down by type of council, 96 per cent of districts and 91 per cent of single-tier and county councils also thought this. However, 79 per cent of district councils thought this to a great extent – compared to 67 per cent of single-tier and county councils. Seventeen per cent of district council thought this to a moderate extent – compared to 24 per cent of single-tier and county councils.
|
|
Total Per cent |
Districts Per cent |
Single-tier and counties Per cent |
|---|---|---|---|
| To a great or moderate extent |
94% |
96% |
91% |
| To a great extent |
73% |
79% |
67% |
| To a moderate extent |
21% |
17% |
24% |
| To a small extent |
5% |
4% |
6% |
| Not at all |
0% |
0% |
0% |
| Don’t know |
1% |
0% |
3% |
National Victim Support
Councils were asked what support services were available to victims of ASB in their area. As shown in Table 13, the most common support services available were victim support (87 per cent), neighbourhood watch (60 per cent) and ASB help (37 per cent). When the responses were split into type of council, these were also the top services in districts and single-tier and county councils.
Unweighted base: all respondents (125)
Thirty-two councils provided ‘other’ support services they made available to victims, including:
- victim support or officers, sometimes these were only for higher risk cases
- specialised help / coaching
- specific Council services
- other than the areas above, respondents mentioned mediation services, crime stoppers, community safety advice, a disability organisation and housing services.
Respondents were asked how often they referred victims of anti-social behaviour to Victim Support. As can be seen in Table 14, overall, 38 per cent of councils referred victims very or fairly often. Forty-one per cent of district councils and 35 per cent of single-tier and county councils reported this. Seven per cent of district councils said they very often referred victims, and 34 per cent said they did this fairly often – whilst 13 per cent were doing this very often and 22 per cent fairly often in single-tier and county councils.
|
|
Total Per cent |
Districts Per cent |
Single-tier and counties Per cent |
|---|---|---|---|
| Very or fairly often |
38% |
41% |
35% |
| Very often |
10% |
7% |
13% |
| Fairly often |
28% |
34% |
22% |
| Occasionally |
47% |
52% |
42% |
| Never |
10% |
5% |
14% |
| Don’t know |
5% |
1% |
9% |
Unweighted base: all respondents (125)
Respondents were asked how often Victim Support has been involved in supporting victims of ASB during the ASB case review process. As shown in Table 15, 15 per cent of councils reported that Victim Support had been very or fairly often involved. When the data is broken down by type of council, 21 per cent of districts said very or fairly often – whilst only 10 per cent of single-tier and county councils said this. Forty-six per cent of councils overall said Victim Support had been involved occasionally – 41 per cent of district councils and 49 per cent of single-tier and county councils said this. Among districts, 30 per cent said Victim Support had never been involved – compared to 21 per cent of single-tier and county councils also saying this. Overall, 14 per cent of councils answered don’t know – when broken down, 8 per cent of districts were unsure compared to 20 per cent of single-tier and county councils.
|
|
Total Per cent |
Districts Per cent |
Single-tier and counties Per cent |
|---|---|---|---|
| Very or fairly often |
15% |
21% |
10% |
| Very often |
8% |
12% |
5% |
| Fairly often |
7% |
9% |
5% |
| Occasionally |
46% |
41% |
49% |
| Never |
25% |
30% |
21% |
| Don’t know |
14% |
8% |
20% |
Unweighted base: all respondents (125)
Councils were asked how strongly they believed that victims of ASB should receive national victim support. As shown in Table 16, two-thirds (65 per cent) of respondents answered very or fairly strongly. Thirty-nine per cent of district councils very strong believed this, compared to 29 per cent of single-tier and county councils. Of the responding district councils, 25 per cent of them slightly strongly believed this, whilst only 12 per cent of single-tier and county council felt this. Ten per cent of single-tier and county councils believed not at all strongly that victims of ASB should receive national victim support, compared to 3 per cent of district councils who believed this. Sixteen per cent of single-tier and county councils answered, ‘don’t know’, compared to 3 per cent of district councils.
|
|
Total Per cent |
Districts Per cent |
Single-tier and counties Per cent |
|---|---|---|---|
| Very or fairly strongly |
65% |
69% |
62% |
| Very strongly |
34% |
39% |
29% |
| Fairly strongly |
31% |
30% |
33% |
| Slightly strongly |
18% |
25% |
12% |
| Not at all strongly |
7% |
3% |
10% |
| Don’t know |
10% |
3% |
16% |
Unweighted base: all respondents (125)
Councils were asked how confident they were that a national approach in supporting ASB victims would be more effective compared to the current local approach. As shown in Table 17, a third (36 per cent) of all councils were either very or fairly confident – comprising 40 per cent of districts and 32 per cent of single-tier and county councils. When looking at the data further broken down by type of council, 19 per cent of district councils were very confident, whilst only 8 per cent of single-tier and county councils felt this. Thirty-one per cent of districts were slightly confident, compared to 16 per cent single-tier and county councils. A third (32 per cent) of single-tier and county councils reported that they were not at all confident, compared to 23 per cent of district. Twenty per cent of single-tier and county councils answered, ‘don’t know’, whilst only 6 per cent of districts were unsure.
|
|
Total Per cent |
Districts Per cent |
Single-tier and counties Per cent |
|---|---|---|---|
| Very or fairly confident |
36% |
40% |
32% |
| Very confident |
14% |
19% |
8% |
| Fairly confident |
22% |
21% |
24% |
| Slightly confident |
23% |
31% |
16% |
| Not at all confident |
27% |
23% |
32% |
| Don’t know |
13% |
6% |
20% |
Unweighted base: all respondents (125)
County court delays and challenges
Councils were asked what challenges they faced when dealing with ASB cases in the current court system. As shown in Table 18, the most frequently reported challenge was cases involving mental health and lack of engagement from mental health services, indicated by 86 per cent of respondents. Other top challenges councils faced were: delays securing a possession hearing for both discretionary and mandatory grounds (65 per cent), and confusion around enforcement actions to be taken around some types of anti-social behaviour (62 per cent). When looking at the data broken down by type of council these were also the top three challenges in district and single-tier and county councils. In single-tier and county councils, 71 per cent said delays securing a possession hearing for both discretionary and mandatory grounds was a challenge for them – compared to 59 per cent of district councils saying this. Sixty-seven per cent of district councils had challenges with confusion around enforcement actions to be taken around some types of anti-social behaviour – compared to 58 per cent of single-tier and county councils saying this.
|
|
Total Per cent |
Districts Per cent |
Single-tier and counties Per cent |
|---|---|---|---|
| Challenges around cases involving mental health and lack of engagement from mental health services |
86% |
84% |
88% |
| Delays securing a possession hearing for both discretionary & mandatory grounds |
65% |
59% |
71% |
| Confusion around enforcement actions to be taken around some types of anti-social behaviour |
62% |
67% |
58% |
| Delays in criminal court for convictions of serious offences following breach of a tenancy |
42% |
30% |
52% |
| Challenges from county court judges to grant a possession under mandatory grounds |
35% |
30% |
40% |
| Difficulty obtaining without notice Injunctions without notifying the perpetrator |
30% |
32% |
28% |
| Delays in Bailiff appointments |
25% |
22% |
27% |
Unweighted base: all respondents (86)
Respondents were asked what the usual timescale was for an on-notice ASB injunction first court hearing, following submission of their application to court. As shown in Table 19, 29 per cent said one to four weeks, 48 per cent said one to two months, 16 per cent said 3 months and 7 per cent said more than three months. In single-tier and county councils, half (50 per cent) said one to two months – 45 per cent of district councils also said this.
|
|
Total Per cent |
Districts Per cent |
Single-tier and counties Per cent |
|---|---|---|---|
| 1 – 4 weeks |
29% |
23% |
34% |
| 1 – 2 months |
48% |
45% |
50% |
| 3 months |
16% |
23% |
10% |
| More than 3 months |
7% |
10% |
5% |
Unweighted base: all respondents (68).
Respondents were asked, following the first court hearing, what the usual timescale was for a first return to court hearing for an on-notice ASB injunction. As shown in Table 20, 21 per cent of councils responded one to four weeks, 48 per cent responded one to two months, 17 per cent responded three months, and 14 per cent responded more than three months. Fifty-eight per cent of single-tier and counties answered one to two months, 35 per cent of district councils also said this. Twenty-nine per cent of districts answered one to four weeks, compared to 15 per cent of single-tier and counties. Twenty-one per cent of district councils said three months – compared to 14 per cent of single-tier and counties.
|
|
Total Per cent |
Districts Per cent |
Single-tier and counties Per cent |
|---|---|---|---|
| 1 – 4 weeks |
21% |
29% |
15% |
| 1 – 2 months |
48% |
35% |
58% |
| 3 months |
17% |
21% |
14% |
| More than 3 months |
14% |
15% |
13% |
Unweighted base: all respondents (63)
Councils were asked, following submission of their application to the court, what the usual timescale was for an ASB court hearing. As can be seen in Table 21, overall 41 per cent of councils responded one to two months, followed by 34 per cent saying more than three months. Among district councils, 44 per cent said more than three months, and 30 per cent said one to two months. In single-tier and county councils, just under half (49 per cent) said one to two months, and a further 26 per cent said more than three months.
|
|
Total Per cent |
Districts Per cent |
Single-tier and counties Per cent |
|---|---|---|---|
| 1 – 4 weeks |
10% |
8% |
11% |
| 1 – 2 months |
41% |
30% |
49% |
| 3 months |
16% |
17% |
15% |
| More than 3 months |
34% |
44% |
26% |
Unweighted base: all respondents (53)
Councils were asked to what extent they supported the creation of a specialist housing court for ASB cases. As shown in Table 22, nearly three quarters (72 per cent) of councils said they support it to a great or moderate extent. When the data is broken down by type of council the findings are similar, 73 per cent of districts and 72 per cent of single-tier and county councils also said this.
|
|
Total Per cent |
Districts Per cent |
Single-tier and counties Per cent |
|---|---|---|---|
| To a great or moderate extent |
72% |
73% |
72% |
| To a great extent |
47% |
46% |
48% |
| To a moderate extent |
25% |
27% |
24% |
| To a small extent |
9% |
7% |
10% |
| Not at all |
2% |
1% |
2% |
| Don’t know |
17% |
19% |
15% |
Unweighted base: all respondents (123)
Respondents were asked how effective they thought a specialist housing court would be in making ASB case resolutions. As shown in Table 23, 77 per cent of councils thought it would be very or fairly effective. When the data is broken down by type of councils, very similar findings were shown – 78 per cent of districts and 75 per cent single-tier and county councils thought this.
|
|
Total Per cent |
Districts Per cent |
Single-tier and counties Per cent |
|---|---|---|---|
| Very or fairly effective |
77% |
78% |
75% |
| Very effective |
39% |
37% |
41% |
| Fairly effective |
38% |
41% |
34% |
| Slightly effective |
6% |
4% |
7% |
| Not at all effective |
0% |
0% |
0% |
| Don’t know |
18% |
18% |
18% |
Unweighted base: all respondents (123)
Data Collection
Respondents were asked how significant the issue of ASB is in their area. As shown in Table 24, 89 per cent of councils responded it was very or fairly significant. Out of the single-tier and county councils responding, 91 per cent of them also said this – yet among districts this was slightly lower, at 86 per cent. Just over half (53 per cent) of single-tier and county councils said it was a very significant issue, compared to 28 per cent of districts saying this whilst 58 per cent of districts said it fairly significant, compared to 38 per cent of single-tier and counties. Fifteen per cent of districts said it was slightly significant, however, only 3 per cent of single-tier and county councils said this.
|
|
Total Per cent |
Districts Per cent |
Single-tier and counties Per cent |
|---|---|---|---|
| Very or fairly significant |
89% |
86% |
91% |
| Very significant |
41% |
28% |
53% |
| Fairly significant |
48% |
58% |
38% |
| Slightly significant |
9% |
15% |
3% |
| Not at all significant |
0% |
0% |
1% |
| Don’t know |
2% |
0% |
5% |
Unweighted base: all respondents (123)
From a list of anti-social actions taken, respondents were asked which of them they report to their board. As shown in Table 25, the top three actions taken to the board were community protection notices (76 per cent), community protection warnings (73 per cent) and injunctions (64 per cent). These were also the top actions in both districts and single-tier and counties. In single-tier and county councils, 69 per cent of those responding said injunctions, compared to 58 per cent districts responding.
|
|
Total Per cent |
Districts Per cent |
Single-tier and counties Per cent |
|---|---|---|---|
| Community protection notices (CPN) |
76% |
73% |
78% |
| Community protection warnings (CPW) |
73% |
75% |
72% |
| Injunction |
64% |
58% |
69% |
| Warnings |
56% |
53% |
59% |
| Acceptable behaviour contracts |
45% |
41% |
49% |
| Eviction |
42% |
37% |
47% |
| Possession |
39% |
32% |
46% |
| Mediation referral |
32% |
33% |
32% |
| Drug and alcohol referral |
19% |
11% |
26% |
Unweighted base: all respondents (121).
Councils were asked which organisations they shared statistical information externally with. As shown in Table 26, the top three organisations councils shared information with were CSPs (90 per cent), police (77 per cent), and police and crime commissioners (74 per cent). When the data was broken down by type of council, these were also the top organisations district and single-tier and county councils shared information with. Eighty-five per cent of single-tier and county councils shared information with police, compared to 69 per cent of district councils.
|
|
Total Per cent |
Districts Per cent |
Single-tier and counties Per cent |
|---|---|---|---|
| Community Safety Partnerships (CSPs) |
90% |
91% |
89% |
| Police |
77% |
69% |
85% |
| Police and crime commissioners |
74% |
70% |
77% |
| Government |
33% |
30% |
37% |
| Fire and rescue services |
32% |
32% |
33% |
| Health |
27% |
24% |
30% |
| Social housing regulator |
26% |
23% |
29% |
| Regional government |
23% |
27% |
18% |
| Voluntary and community sector |
18% |
16% |
21% |
| Metro mayors |
6% |
0% |
12% |
| Other Organisations |
11% |
6% |
16% |
Unweighted base: all respondents (119)
Councils were asked which organisations they shared case information externally with. As shown in Table 27, the top three organisations councils shared case information with were: police (93 per cent), CSPs (67 per cent) and fire and rescue services (46 per cent). When the data is broken down by type of council these were also the top organisations. All (100 per cent) of single-tier and county councils shared case information with police, compared to 86 per cent of district councils. Three-quarters (74 per cent) of districts shared information with CSPs, compared to 61 per cent of single-tier and county councils. Half (50 per cent) of districts said they shared case information with fire and rescue services, compared to 42 per cent of single-tier and county councils.
|
|
Total Per cent |
Districts Per cent |
Single-tier and counties Per cent |
|---|---|---|---|
| Police |
93% |
86% |
100% |
| Community Safety Partnerships (CSPs) |
67% |
74% |
61% |
| Fire and rescue services |
46% |
50% |
42% |
| Health |
44% |
48% |
40% |
| Police and crime commissioners |
37% |
39% |
36% |
| Social housing regulator |
23% |
20% |
25% |
| Voluntary and community sector |
18% |
15% |
21% |
| Government |
17% |
19% |
16% |
| Regional government |
8% |
9% |
7% |
| Metro mayors |
2% |
0% |
4% |
| Other Organisations |
15% |
16% |
15% |
Unweighted base: all respondents (118).
Twenty councils provided details of other organisations they shared case information with, which are grouped and listed below:
- registered social landlords
- children’s services
- social care
- alcohol or drug dependency units
- violence reduction unit
- youth support.
Adult versus youth ASB
Respondents were asked what percentage of adult-related ASB has been fully investigated and closed in the last 12 months. As shown in Table 28, overall, 31 per cent of councils fully investigated and closed 81 to 100 per cent of adult-related ASB cases. When the data is broken down by type of council, a third (34 per cent) of districts and 28 per cent of single-tier and counties fully investigated and closed 81 to 100 per cent of cases. Thirty-four per cent of councils answered that they didn’t know what percentage of cases had been fully investigated and closed in the last 12 months.
|
|
Total Per cent |
Districts Per cent |
Single-tier and counties Per cent |
|---|---|---|---|
| 81-100 per cent |
31% |
34% |
28% |
| 61-80 per cent |
19% |
15% |
23% |
| 41-60 per cent |
7% |
11% |
3% |
| 21-40 per cent |
6% |
6% |
6% |
| 0-20 per cent |
3% |
1% |
4% |
| Don’t know |
34% |
32% |
36% |
Unweighted base: all respondents (118)
Councils were asked what percentage of young people-related ASB cases were fully investigated and closed in the last 12 months. As shown in Table 29, 17 per cent of all councils had investigated and closed between 81 and 100 per cent of cases – this was 22 per cent among district councils, and 13 per cent among single-tier and county councils. Forty-one per cent of councils answered that they didn’t know.
|
Type |
Total Per cent |
Districts Per cent |
Single-tier and counties Per cent |
|---|---|---|---|
| 81-100 |
17% |
22% |
13% |
| 61-80 |
11% |
9% |
13% |
| 41-60 |
9% |
8% |
9% |
| 21-40 |
10% |
15% |
5% |
| 0-20 |
13% |
9% |
16% |
| Don’t know |
41% |
37% |
44% |
Unweighted base: all respondents (118)
Respondents were asked what the age range was of the young people-related ASB cases that were fully investigated and closed in the last 12 months. As shown in Table 30, the most common age range of youth cases was 11 to 14 year olds, as reported by 32 per cent of councils. When the data was broken down by type of council, the most common age range remained 11 to 14 year olds, with 36 per cent of districts and 27 per cent single-tier and county councils saying this. Forty-five per cent of councils answered they didn’t know – 43 per cent of districts and just under half (48 per cent) of single-tier and county councils.
|
Type |
Total Per cent |
Districts Per cent |
Single-tier and counties Per cent |
|---|---|---|---|
| 7 – 10 Years |
1% |
0% |
1% |
| 11 – 14 Years |
32% |
36% |
27% |
| 15 – 17 Years |
22% |
21% |
24% |
| Don’t know |
45% |
43% |
48% |
Unweighted base: all respondents (118)
Respondents were asked, within the last 12 months, what percentage of the young people involved in ASB cases that had been fully investigated and closed, were in attendance in mainstream educations. As shown in Table 31, unfortunately a large number (63 per cent) of councils answered that they didn’t know. This was also the same when the data was broken down by type of council – 70 per cent of single-tier and counties and 56 per cent of districts answered this.
|
|
Total Per cent |
Districts Per cent |
Single-tier and counties Per cent |
|---|---|---|---|
| 81-100 |
8% |
11% |
4% |
| 61-80 |
9% |
13% |
6% |
| 41-60 |
7% |
7% |
7% |
| 21-40 |
7% |
9% |
5% |
| 0-20 |
6% |
5% |
7% |
| Don’t know |
63% |
56% |
70% |
Unweighted base: all respondents (118)
Respondents were asked what percentage of the closed cases on young people had action taken against them. As shown in Table 32, unfortunately a large (52 per cent) of councils answer that they didn’t know, whilst a quarter (26 per cent) answered 0 to 20 per cent. This was also the same when the data was broken down by type of council – 58 per cent and 47 per cent of single-tier and counties districts respectively reported that they didn’t know.
|
|
Total Per cent |
Districts Per cent |
Single-tier and counties Per cent |
|---|---|---|---|
| 81-100 |
4% |
3% |
5% |
| 61-80 |
1% |
3% |
0% |
| 41-60 |
5% |
8% |
2% |
| 21-40 |
11% |
16% |
7% |
| 0-20 |
26% |
24% |
28% |
| Don’t know |
52% |
47% |
58% |
Unweighted base: all respondents (117)
Councils were asked what actions had been taken against the young people. As shown in Table 33, a third (32 per cent) said acceptable behaviour contract and referral to agency for preventative work, whilst 20 per cent said parental support. The responses were very similar when the data was broken down by type of council – 33 per cent of single-tier and counties and 31 per cent of districts said acceptable behaviour contract.
|
|
Total Per cent |
Districts Per cent |
Single-tier and counties Per cent |
|---|---|---|---|
| Acceptable behaviour contract |
32% |
31% |
33% |
| Referral to agency for preventative work |
32% |
33% |
32% |
| Parental Support |
20% |
20% |
21% |
| Other |
15% |
16% |
15% |
Unweighted base: all respondents (116)
There were thirty-five councils that provided other information about other actions taken, which have been put into the groups below:
- a warning letter
- referral to early intervention schemes
- more formal process of injunctions
- referral to police.
Councils were asked to provide any further information they wanted to share about anti-social behaviour in their areas. Fifty-five councils provided their views, which have been put into the four themes:
- Mental health/substance abuse was a theme in many cases. The fact that services helping in these areas were under strain meant these issues were more prevalent among those perpetrating ASB. Because these were services not run by councils, they felt they had less control over ASB.
“Cut backs / financial pressures in other agencies such as Registered Social Landlords (RSLs), social care, mental health etc have also affected responses to ASB.”
“The increase in mental health issues in our community and the lack of services to help those people has meant resident complaints have increased and ASB has increased because those with mental health issues cannot get support. Investment in mental health services would decrease ASB significantly.”
“The volume and complexity has increased significantly- mental health and substance misuse feature more and more regularly, requiring longer term and more involved casework.”
2. The second theme to emerge was defining ASB. The councils consider ASB a broad term and one which the public have their own view on. Some mentioned that a number of things considered ASB are technically ‘criminal behaviours’.
“The current definition is too vague, bring back the list of 33 types so that more effective monitoring can take place. The profile and images on Google show graffiti as the top type of ASB, when this is actually criminal damage.”
“Defining what is ASB/ the difference between ASB and criminal matters /navigating between ASB and Neighbourhood disputes/inconsistencies between local authorities and what they would investigate. Defined thresholds for ASB would be helpful especially when assessing threat risk and harm.”
“Public think ASB includes Fly tipping and Abandon Vehicles - which is not ASB - but rather envirocrime not ASB. This distinction needs to be clear in public perception.”
3. The multi-agency/disciplinary approach features both when working well and not so well. When not working well it is more from the point of view of not being joined up than any of those agencies not being good.
“… In addition to this a new ASB reporting tool has been designed and greater working and communication between departments established.”
“We are doing a lot of work with the PCC and Police around urban street gangs and organised gangs to design out ASB.”
“We are finding CPWs incredibly effective …. with compliance rates of 91%. This has been effective due to partnership working in relation to delivery.”
“However, the under resourcing of housing providers who fail to enforce tenancies in line with their ASB policies is a frustration.”
“… it is difficult to capture everything as different types of incidents will be dealt with by different service areas across the authority. Having a consistent, national recording system would be help to bring records of cases into one place and provide an overall performance management framework.”
“We have a low % of ASB …. especially around young people and that may be attributed to the fact that as a CSP we try and put in place intervention and diversion using 1-1 mentoring projects and education and awareness raising.”
“We have a unique multi-agency model between the local councils and constabulary who work as a team to tackle anti-social behaviour.”
4. The lack of sufficient resources was mentioned by some.
“We are under resourced and have a significant lack of a local and national framework for officers to adhere to.”
“Managing ASB is far wider than before with issues like County Lines, Modern Slavery and cuckooing also being linked. This can affect capacity within organisations.”
Annex A: Questionnaire
Introduction
Thank you for taking the time to complete this survey. You can navigate through the questions using the buttons at the bottom of each page. Use the 'previous' button at the bottom of the page if you wish to amend your response to an earlier question.
If you stop before completing the return, you can come back to this page using the link supplied in the email and you will be able to continue where you left off. To ensure your answers have been saved, click on the 'next' button at the bottom of the page that you were working on before exiting.
All responses will be treated confidentially. Information will be aggregated, and no individual or authority will be identified in any publications without your consent. Identifiable information may be used internally within the LGA but will only be held and processed in accordance with our privacy statement. We are undertaking this survey to aid the legitimate interests of the LGA in supporting and representing authorities.
If you would like to see an overview of the questions before completing the survey online, you can access a PDF here: Anti social behaviour
Please amend the details we have on record if necessary.
If you are responding on behalf of more than one authority please note this in the 'authority' box below, but please check with us first whether a separate return is needed for each authority.
- Name
- Authority
- Job title
- Email address
Information sharing
Which organisations, if any, does your council currently share information related to antisocial behaviour (ASB) incidents with?
- Government
- Police
- Probation services
- Housing providers
- Health services
- Drug and alcohol services
- Fire and Rescue Services
- Education authorities
- Multi-agency risk assessment conference (MARAC)
- Other- please specify
- None of the above
Which organisations, if any, does your council currently receive information related to ASB incidents from?
- Government
- Police
- Probation services
- Housing providers
- Health services
- Drug and alcohol services
- Fire and Rescue Services
- Education authorities
- Multi-agency risk assessment conference (MARAC)
- Other- please specify
- None of the above
What barriers, if any, does your council face in sharing ASB-related information across different organisations?
- Data sharing agreements
- Incompatible computer systems
- Differences in data definitions and scope
- Changing personnel within partner organisations
- Lack of willingness within the council
- Lack of willingness among partner organisations
- Lack of required technical skills
- Lack of staff resources and capacity
- Other- please specify
Do you have one or more signed information-sharing agreements in place with partner organisations?
- Yes
- No
- Don’t know
From the list of stakeholders below, please tick which ones your council has a signed information-sharing agreement in place with.
- Police
- Probation services
- Housing providers
- Health services
- Drug and alcohol services
- Fire and Rescue Services
- Education authorities
- MARAC
- Other- please specify
To what extent, if at all, does the sharing of information between stakeholders cause you delays in your investigations and taking actions against perpetrators?
- To a great extent
- To a moderate extent
- To a small extent
- Not at all
- Don’t know
Would your council support the implementation of a single national information-sharing agreement for ASB data?
- Yes
- No
- Don’t know
Access to housing providers to Community Safety Partnerships (CSPs)
To what extent, if at all, are housing providers in your area currently involved in CSPs?
- To a great extent
- To a moderate extent
- To a small extent
- Not at all
- Don’t know
How strongly, if at all, does your council believe that housing providers should have full access to CSPs?
- Very strongly
- Fairly strongly
- Not very strongly
- Not at all strongly
- Don’t know
To what extent, if at all, do you think a closer relationship between housing providers and CSPs lead to improved outcomes relating to ASB?
- To a great extent
- To a moderate extent
- To a small extent
- Not at all
- Don’t know
National victim support for victims of ASB
What support services are currently available to victims of ASB in your area?
- Victim support
- Victims first
- Voice
- Beacons
- Victims care and advice services
- Supporting victims
- Neighbourhood watch
- ASB help
- Victim care
- Other- please specify
- None of these
How often, if at all, do you refer victims of anti-social behaviour to Victim Support?
- Very often
- Fairly often
- Occasionally
- Never
- Don’t know
How often, if at all, have Victim Support been involved in supporting victims of ASB during the ASB Case Review Process?
- Very often
- Fairly often
- Occasionally
- Never
- Don’t know
How strongly, if at all, do you believe that victims of ASB should receive national victim support?
- Very strongly
- Fairly strongly
- Slightly strongly
- Not at all strongly
- Don’t know
How confident are you, if at all, that a national approach in supporting ASB victims would be more effective compared to the current local approach?
- Very confident
- Fairly confident
- Slightly confident
- Not at all confident
- Don’t know
County court delays and challenges
What challenges, if any, do you face when dealing with ASB cases in the current court system?
- Delays securing a possession hearing for both discretionary & mandatory grounds.
- Challenges from county court judges to grant a possession under mandatory grounds.
- Difficulty obtaining without notice Injunctions without notifying the perpetrator.
- Confusion around enforcement actions to be taken around some types of anti-social behaviour.
- Delays in Bailiff appointments.
- Challenges around cases involving mental health and lack of engagement from mental health services.
- Delays in criminal court for convictions of serious offences following breach of a tenancy
- N/A
Following submission of your application to court, what is the usual timescale for an on-notice anti-social behaviour injunction first court hearing?
- 1 – 4 weeks
- 1 – 2 months
- 3 months
- More than 3 months
- N/A
Following the first court hearing, what is the usual timescale for a first return court hearing for an on-notice anti-social behaviour injunction?
- 1 – 4 weeks
- 1 – 2 months
- 3 months
- More than 3 months
- N/A
Following submission of your application to the court, what is the usual timescale for an anti-social behaviour possession court hearing?
- 1 – 4 weeks
- 2 months
- 3 months
- More than 3 months
- N/A
To what extent, if at all, do you support the creation of a specialist housing court for ASB cases?
- To a great extent
- To a moderate extent
- To a small extent
- Not at all
- Don’t know
How effective, if at all, do you think a specialist housing court would be in making ASB case resolutions?
- Very effective
- Fairly effective
- Slightly effective
- Not at all effective
- Don’t know
Data collection
How significant, if at all, is the issue of ASB in your councils area?
- Very significant
- Fairly significant
- Slightly significant
- Not at all significant
- Don’t know
From the list of anti-social actions taken, please tick which of these, if any, do you report to your board
- Warnings
- CPW
- Acceptable behaviour contracts
- Mediation referral
- Drug and alcohol referral
- CPN
- Injunction
- Possession
- Eviction
From the list below, which organisations does your council share statistical information externally with:
- Government
- Police and crime commissioners
- Regional government
- Metro mayors
- Health
- Police
- Social housing regulator
- Voluntary and community sector
- Fire and rescue services
- Community Safety Partnerships
- Other Organisations (please specify)
From the list below, which organisations does your council share case information externally with:
- Government
- Police and crime commissioners
- Regional government
- Metro mayors
- Health
- Police
- Social housing regulator
- Voluntary and community sector
- Fire and rescue services
- Community Safety Partnerships
- Other Organisations (please specify)
Adult nuisance V youth nuisance
What percentage of adult related ASB have you fully investigated and closed, in the last 12 months?
- 81-100
- 61-80
- 41-60
- 21-40
- 0-20
- Don’t know
What percentage of young people related ASB have you fully investigated and closed in the last 12 months?
- 81-100
- 61-80
- 41-60
- 21-40
- 0-20
- Don’t know
What was the age range of the young people related ASB you fully investigated and closed in the last 12 months?
- 7 – 10 Years
- 11 – 14 Years
- 15 – 17 Years
- Don’t know
Within the last 12 months, what percentage of the young people related to ASB that you fully invested and closed, were in attendance in mainstream education?
- 81-100
- 61-80
- 41-60
- 21-40
- 0-20
- Don’t know
What percentage of these closed cases on young people had action taken against them
- 81-100
- 61-80
- 41-60
- 21-40
- 0-20
- Don’t know
What was the action taken against the young people?
- Acceptable behaviour contract
- Referral to agency for preventative work
- Parental Support
- Other (please specify)
Any other information
Please use the space below to tell us anything more about anti-social behaviour in your area
_______________________________________________________________________________
_______________________________________________________________________________
_______________________________________________________________________________
_______________________________________________________________________________
_______________________________________________________________________________
Once you press the 'Submit' button below, you will have completed the survey.
Many thanks for taking the time to complete this survey. You are in control of any personal data that you have provided to us in your response. You can contact us at all times to have your information changed or deleted. You can find our full privacy policy here: click here to see our privacy policy