Executive summary
Rationale
This analysis seeks to explain why some councils in England spend more on public health than others.
Public health spending is first compared with resident population, showing that areas with more people have higher public health grant expenditure.
A rate of spending on public health per head of population is then calculated, and predictive models are run to attempt to explain variations in this spending rate between local authority areas:
- First, a model explaining this variation using the rate of public health grant provision, showing that local authorities spend more per person where they receive more grant funding per person
- Finally, a series of models explaining the variation in spend per person based on local needs and circumstances, showing that local authorities spend more per person where they have greater local needs for public health interventions.
Whilst factors illustrative of local needs may be highly correlated with grant provision, grant levels are currently not directly calculated using a needs-based formula, hence the importance of also looking at the influence of local needs directly.
Causal relationships cannot be proven with this analysis, which can only explore which factors are most strongly related to the rate of spending on public health per person.
Background
English councils spent over 3.2bn on public health in 2019/20. This is a decrease of £50m from 2018/29 and a decrease of £252m, or seven per cent, from 2016/17.
The highest spending subdivisions of public health were Miscellaneous public health services - Children's 0–5 services (prescribed functions) (22 per cent of total net current expenditure on public health), Miscellaneous public health services (12 per cent), Substance misuse - Treatment for drug misuse in adults (11 per cent), and Sexual health services - STI testing and treatment (prescribed functions) (10 per cent). The remainder of spending was spread across a wide range of different service areas, which can broadly be grouped under the following categories:
- children’s public health programmes and services
- substance misuse
- sexual health services
- Smoking and tobacco
- physical activity
- public mental health
- obesity
- the NHS Health Check Programme
- public health advice
- the local authority role in health protection
- the national child measurement programme
- health at work.
Analysis by the Health Foundation shows that, in real terms (accounting for inflation), the public health grant has reduced by over £1 billion (24 per cent) compared to the financial year 2015/16.
Spending and population
In general, there was a strong positive relationship between the size of a local authority’s resident population and its level of net current expenditure on public health. This means that local authorities with larger resident populations also tended to have higher levels of expenditure on public health services.
Dividing an authority’s total expenditure on public health by its resident population (with adjustments made for area costs: see technical report) gives its rate of spending on public health per person.
In 2019/20 this spending rate varied from around £27 per person at the authority with the lowest rate to around £156 per person at the authority with the highest rate. This means that there was a difference of around £129 between the authority with the lowest rate and the authority with the highest rate. A typical value, the median, was around £58 per person. A typical spending rate for a lower-spending council, the lower quartile, was around £43, and a typical rate for a higher-spending council, the upper quartile, was around £79. The difference between the highest and lowest of the most typical councils – the interquartile range – was around £36.
Explaining variation in the spending rate – two stages
To attempt to explain the above variations in the spending rate, a series of statistical models were run which used one or more other factors to explain the rate of expenditure. These models began with the immediate antecedent of spending – grant allocations – before moving back to the logical antecedent of both grant allocations and direct expenditure – local needs and circumstances resulting in demand for public health services.
The following models were run:
- a model explaining variations in the rate of public health expenditure using variations in the rate of grant allocations
- a model explaining variations in the rate of public health expenditure using variations in local needs and circumstances
- four models explaining variations in rates of specific categories of public health expenditure using variations in local needs and circumstances, focusing on:
- drugs and alcohol
- obesity
- services for 0-5 year olds
- smoking.
At present, public health grant allocations are based largely on historic levels of expenditure by National Health Service providers when public health was provided by the NHS. Whilst proposals have been developed to allocate future grant funding directly on the basis of local needs for services, these proposals have yet to be implemented. As such, it is important to examine the influences of both grant allocations and local needs on these rates of expenditure.
Public health spending and grant allocations
The rate of public health spending was found to be strongly and significantly predicted by the rate of public health grant allocations, suggesting that authorities which spent more per person on public health did so because they received a proportionately larger grant in recognition of their more acute local public health needs. The rate of grant allocations was found to explain over 90 per cent of the rate of public health spending.
Explaining variation in spending rates
To more directly measure the extent to which local public health needs explains variation in public health spending, a series of statistical models were run aiming to use a variety of factors including deprivation, life expectancy and incidence of health problems to explain the overall spending rate on public health and four specialised spending rates on drugs and alcohol, obesity, services for 0-5 year olds and smoking. These models demonstrated that some or all of the following measures of need explained 76 per cent of variation in the overall spending rate and significant proportions of variation in the more specialised spending rates:
- Deprivation, including the overall Index of Multiple Deprivation (IMD), the Living Environment Deprivation sub-domain, and the Income Deprivation Affecting Children Index (IDACI). Local authorities with greater deprivation tend to also have higher spending rates overall and for obesity and 0-5 services
- Life expectancy, healthy life expectancy and disability free life expectancy (each as an average of male and female). Local authorities with higher life and related expectancies tended to have lower public health spending rates, demonstrating that the areas with the lowest life expectancy tended to have the highest public health spending rates on all topics
- Hospital admissions for alcohol specific conditions, and rehabilitation rates for substance abuse. Local authorities with higher prevalence on these statistics tended to have higher drugs and alcohol spending rates
- Average diagnosis rate for a range of common sexually transmitted infections (STIs). Local authorities with higher STI diagnosis rates tended to have higher overall public health spending rates
- Rate of children looked after per 10,000 children. Local authorities with higher rates of children looked after tended to have higher spending rates overall and for drugs and alcohol services
- Rate of under 18 births per 1,000. Local authorities with higher rates of under 18 births tended to have lower spending rates for obesity services
- Prevalence of child obesity at Year 6 according to the National Child Measurement Programme. Local authorities with a higher percentage of obese 10-11 year olds tended to have higher spending rates for obesity services
- Percentage of residents who are Asian or Asian British. Local authorities with a higher percentage of Asian or Asian British residents tended to have lower rates of spending on obesity services, but higher rates of spending on services for 0-5 year olds
- Total population. Local authorities with a higher total population tended to have lower spending rates on public health overall and obesity services.
Technical report: introduction
The Local Government Association (LGA) has undertaken a series of statistical analyses which seek to understand differences in spending per unit of population between councils. The overall finding of this analysis is that local factors outside of councils’ control are responsible for over three quarters of variation in spend on public health per person between English councils.
This report uses data extracted from Government outturn reports and a variety of other metrics which describe councils and local areas, most of which is available from LG Inform. This data was fed into statistical models in a widely recognised process known as linear regression analysis, which explains variation in one metric based on a number of other metrics.
In this case, the models were looking to explore how much of the variation in spending on public health per person can be explained using factors which are beyond councils’ control. As such, the variation explained by the model is a figure which councils would find very difficult to reduce. The unexplained variation which falls outside of the model is not necessarily easy to reduce; it may be within or outside of councils’ control.
This report uses statistical analysis to describe and identify factors commonly associated with variation in spending, although statistical associations cannot be used to prove causal relationships.
The analysis applies to all upper and single-tier councils in England in the financial year 2019/20.
It is notoriously difficult to explain variation in spend on local government services, since the factors or combination of factors are invariably complex. Some of the explanatory factors identified by reliable statistical modelling may nevertheless be counter-intuitive and difficult to readily interpret. In this report the LGA sets out some first thoughts towards explaining why particular variables have an impact, but we would welcome thoughts or evidence from others.
Technical report: Public health spending and resident population
Spending figures for each authority have been obtained from the UK Government’s local authority revenue expenditure and financing data. The metric of spending used was net current expenditure, which excludes spending funded by sales, fees and charges. This is because the categorisation of grant income was not always uniform across councils. Net current expenditure includes all forms of grant income by default, and as such represents the most consistent available measure of spending for comparison between councils.
Correlational analysis between local authorities’ level of public health expenditure and their resident population revealed a close and highly statistically significant positive relationship between the two (Pearson correlation coefficient of 0.82). This demonstrated that areas with higher than usual expenditure on public health tended also to have higher than usual populations, strongly suggesting that total expenditure is largely a function of the size of the population which local authorities serve.
The rest of this analysis focuses not on the total amount of spending on public health for each authority, but on the rate of public health spending per person in the resident population. The denominator of resident population was taken from the Office of National Statistics (ONS) mid-year population estimates 2019. The measure for spend per person was calculated according to the following formula:
(Spend on public health)
(Number of residents x public health area cost adjustment)
Area cost adjustment, otherwise known as the market forces factor (MFF), refers to a weighting calculated by the UK Government to compensate English authorities for differences in costs in different parts of the country due to variations in labour costs and business rates. A measure which includes and thus removes the effects of area costs provides a more comparable metric between different councils.
Technical report: Variation in spending rates between councils
The 2019/20 spending rate varied from around £27 per person at the authority with the lowest rate to around £156 per person at the authority with the highest rate. This means that there was a difference of around £129 between the authority with the lowest rate and the authority with the highest rate. A typical value, the median, was around £58 per person[8].
A typical spending rate for a lower-spending council, the lower quartile, was around £43, and a typical rate for a higher-spending council, the upper quartile, was around £79. The difference between the highest and lowest of the most typical councils – the interquartile range – was around £36.[9]
|
|
£ per person |
|---|---|
| Minimum (lowest spending rate) | £27 |
| Lower quartile (typical for lower spending rate) | £43 |
| Median (typical for councils overall) | £58 |
| Upper quartile (typical for higher spending rate) | £79 |
| Maximum (highest spending rate) | £156 |
| Range between minimum and maximum | £129 |
| Interquartile range between lower and upper quartiles | £36 |
| Mean (total of all councils’ spending rate divided by the number of councils) | £63 |
| Standard deviation (average distance from the mean for any particular council) | £24 |
[8] For comparison, the mean, another kind of average, was around £63. The mean is less representative of a typical authority than the median due to its tendency to be skewed by unusually low or high values.
[9] The standard deviation of council spending rates for older people was £24. Just as the mean and median are different but valid measures of an average, so the standard deviation and interquartile range are different but valid measures of variation. The standard deviation should be used in conjunction with the mean, as it is the average distance of a given council from the mean, and the interquartile range should be used in conjunction with the median, as both are based on ranking the councils in order of spend per older person and choosing the central, lowest quarter and highest quarter cases.
Technical report: Spending rate and grant allocations
As public health is a service area which is funded by ringfenced grant expenditure, the first step in the attempt to explain the above levels of variation in spend per person is to examine the extent to which they can be explained by corresponding variations in the amount of grant provided. In other words, it would make sense for councils which receive a larger public health grant as a rate per person to have a higher rate of expenditure on public health per person.
For the purpose of this particular part of the analysis, the councils of the City of London and the Isles of Scilly were excluded due to their unique circumstances, which are not readily applicable to other local authorities.
The rate of public health grant allocations was found to strongly and significantly predict the rate of public health expenditure[10]. This means that the rate of grant allocations is very strongly related to the rate of spending, where areas with a higher rate of grant allocations per person tended also to have a proportionately higher rate of public health expenditure per person. This close relationship between grant allocations and expenditure is illustrated by Figure 1 below. In short, some local authorities spend more on public health per person than others because they have been allocated a larger amount of grant funding.
Figure 1. Scatterplot comparing public health grant allocations and spending per person
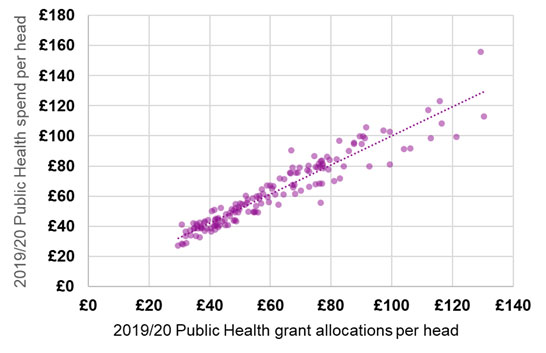
[10] Linear regression analysis, with coefficient of 0.96 and adjusted R Squared of 0.902, showing that the rate of grant allocations explained over 90 per cent of the variation in the rate of spending. The p value for this relationship from the regression model was 2.9 x10-76
Technical report: Explaining variation in the rate of public health spending per person
By and large, then, higher expenditure among some local authorities appears to be a direct result of grant allocations provided to them. To underscore the relationship between levels of need and the rate of spending per person more clearly, a further series of analyses were undertaken to attempt to predict the rate of spending using a collection of metrics representing local public health issues.
Please note that the following analyses do not include the rate of grant allocations, as this has been considered separately in the model above.
Five distinct analyses were undertaken, to attempt to explain variations in the following spending rates:
- The overall rate of expenditure on public health per person, as detailed above;
In addition to four specific spending rates focusing on particular, selected aspects of public health:
- Drugs and alcohol: a rate of expenditure per person on the following three subcategories of public health spending combined:
- Substance misuse – Drug misuse – adults
- Substance misuse – Alcohol misuse – adults
- Substance misuse – (drugs and alcohol) – youth services
- Obesity: a rate of expenditure per person on the following three subcategories of public health spending combined:
- Obesity – adults
- Obesity – children
- National child measurement programme
- Services for 0-5 year olds: a rate of expenditure per person on the following two subcategories of public health spending combined:
- Miscellaneous public health services - Children's 0-5 services
- Miscellaneous public health services - Children's 0-5 services – Other
- Smoking: a rate of expenditure per person on the following two subcategories of public health spending combined:
- Smoking and tobacco - Stop smoking services and interventions
- Smoking and tobacco - Wider tobacco control
The following procedures were followed to run these analyses:
- A set of 86 statistics were collected relating to various aspects of local authorities’ socioeconomic conditions and public health needs[11]. These included factors such as population, deprivation, income, substance misuse, under 18 conceptions and births, diagnosis rates of sexually transmitted infections (STIs), life expectancy, ethnicity and hospital admissions (see Annex A for a complete list).
- These statistics were compared to the rate of spending per person in each model using an iterative, automated modelling process which attempted to explain the rate of spending by running an algorithm which compared tens of thousands of different combinations of the 88 statistics. This process resulted in an optimal model which could explain the biggest percentage of variation in the rate of spending, helping identify which measures of local needs were related to the rate of spending and which were not.
- For each rate of spending, a final model was produced manually, informed by the automated modelling and by the specific topical context of the rate of spending in question. This resulted in a set of measures of local needs for each spending rate which both explained a significant proportion of variations in spending per person between local authorities and offered a coherent conceptual model of how each type of need could plausibly increase demand for public health services.
The modelling process used is known as linear regression analysis. This is a statistical model which measures the extent to which variations in one metric (in this case, spend per older person) are associated with corresponding variations in a set of other metrics. The aim of such modelling is to explain as much of the variation in the target metric as possible, although in practice explaining 100 per cent of variation is unheard of and in complex fields like the social sciences the amount explained rarely exceeds 50 per cent. It is also possible that there are other metrics outside an authority’s control, which are not currently available in statistical collections, which would explain a still greater proportion of this variation were they available.
The results of the five models are described below. Each model provides a statistic demonstrating the percentage of variation in the particular rate of spending which the collection of local need statistics collectively explain[12]. Each model also displays for every explanatory factor included whether the factor in question has a positive relationship with the rate of spending – where a higher score on the factor is related to a higher rate of spending – or a negative relationship, where a higher score is related to a lower rate of spending.
Note that for some factors measuring local health needs and circumstances, such as life expectancy, a higher score indicates lower needs; thus, in such cases, a negative relationship would mean that lower needs are related to a lower rate of spending, thus higher needs are related to a higher rate of spending. All findings are significant to the 95 per cent confidence level, meaning that the chance of each relationship being coincidental rather than systematic was no more than five per cent and often considerably lower.
Table 1 shows the results for the five final models, demonstrating 14 measures of local needs which each help explain one or more of the five spending rates. It can be seen that the models explain varying proportions of their respective spending rates, ranging from 13 per cent in the case of smoking expenditure to 76 per cent in the case of overall public health expenditure. In general, the larger the volume of expenditure, the more successful the models are in explaining the spending rate, with the models for 0-5 services and drugs and alcohol, both among the largest subdivisions of public health expenditure, both explaining a majority of variation in their respective spending rates. It is natural for areas accounting for a lower volume of expenditure to be less explicable by statistical analysis, as differences between smaller numbers tend to have a relatively greater component of chance fluctuations (as opposed to systematic relationships) than equivalent differences between larger numbers.
Measures of deprivation are consistently related to higher levels of expenditure, demonstrating a positive relationship with the overall spending rate and the spending rates for obesity and services for 0-5 year olds. Deprivation is frequently linked to increased health problems, particularly problems affecting children and families such as child obesity.
Conversely, measures of life expectancy and similar measures are consistently related to lower spending rates, meaning that areas with lower life expectancy, healthy life expectancy, and/or disability free life expectancy tend also to have higher spending rates. All five spending rates were significantly influenced by one or another of the measures relating to life expectancy. Lower life expectancy in an area is symptomatic of chronic health difficulties indicating a need for interventions from public health services.
Hospital admissions for alcohol specific conditions, and the rate of people undergoing rehabilitation for substance abuse, are both related to a higher rate of expenditure on drugs and alcohol services. Areas with greater health concerns relating to drugs and alcohol demonstrate a greater need for services tailored to meeting these local needs.
The average diagnosis rate for a range of selected common sexually transmitted infections or STIs (chlamydia, genital warts, genital herpes, gonorrhoea and new HIV infections) is related to a higher spending rate on public health overall. Sexual health services constitute a significant proportion of public health expenditure, and areas with higher rates of STI diagnoses demonstrate a greater need for interventions in this area.
The rate of children looked after is related to a higher spending rate on public health overall and the spending rate on drugs and alcohol. Higher rates of children looked after are symptomatic of wider social problems, including potentially drug and alcohol abuse, likely to result in circumstances requiring particular attention from public health services.
The rate of births to under 18s is related to a lower spending rate on obesity. Whilst it is not entirely clear why this should be the case, there is some evidence that births to teenage mothers are more likely to be underweight, and that children born underweight are likely to remain at a lower than average weight throughout their childhood until their early teenage years. This could slightly reduce the need for obesity-specific public health interventions in areas with frequent teenage pregnancies (though not necessarily reducing the need for other public health interventions, such as those related to sexual health services). Nevertheless, this is a finding which it is difficult to clearly interpret.
The percentage of children in Year 6 who are obese is related to a higher spending rate on obesity. Areas where child obesity is a greater concern would naturally benefit from increased attention from public health services aiming to reduce and prevent obesity.
The percentage of residents who are Asian or Asian British is related to a lower spending rate on obesity, but to a higher spending rate on services to 0-5 year olds. It is possible that these mixed results are the product of lower rates of overweight and obesity among Asian ethnic backgrounds, particularly those of Chinese ethnicity, and higher birth rates and family sizes among these same groups.
Total population is related to a lower spending rate on public health overall and on obesity. The most obvious explanation for this relationship is that areas with a larger population are able to establish economies of scale by implementing services on a wider scale, whilst areas with smaller populations may require public health interventions to be tailored to smaller groups at a greater average cost per person.
Index of Multiple Deprivation (IMD) Overall
| Overall public health | Drugs and alcohol | Obesity | Services for 0-5 year olds | Smoking | |
|---|---|---|---|---|---|
| Percentage of variation explained | 76% | 56% | 26% | 58% | 13% |
| More spend | |||||
| IMD Living Environment Deprivation | More spend | ||||
| IMD Income Deprivation Affecting Children Index (IDACI) | More spend | ||||
| Life expectancy at birth (avg. of male and female) | Less spend | Less spend | Less spend | ||
| Healthy life expectancy at birth (avg. of male and female) | Less spend | ||||
| Disability free life expectancy at birth (avg. of male and female) | Less spend | ||||
| Hospital admissions per 100,000 for alcohol specific conditions (avg. of male and female) | More spend | ||||
| Rehabilitation (substance abuse) per 1,000 people | More spend | ||||
| Average diagnosis rate for STIs | More spend | ||||
| Children looked after per 10,000 | More spend | More spend | |||
| Under 18 births rate per 1,000 | Less spend | ||||
| Obese children in year 6 (%) | More spend | ||||
| % of residents who are Asian/Asian British | Less spend | More spend | |||
| Total population | Less spend | Less spend |
[11] Any values above or below three standard deviations of the mean were trimmed upwards or downwards to that value, to prevent these from skewing the overall results. Any values with missing data were attributed the median value of all councils for which data was available. The variables were all standardised to have a mean of zero and a standard deviation of one, to ensure all relationships were measured on a comparable scale. All 151 local authorities existing in 2019/20 were included in this analysis.
[12] This is known as the Adjusted R Squared statistic. The R Squared statistic is a simple measure of the proportion of variation explained by the factors in the model, but can sometimes be artificially inflated in models with a large number of factors included. The Adjusted R Squared corrects for any biases which this may otherwise have introduced.
Annex A: Potential explanatory metrics tested
| Metric description | Source |
|---|---|
| Total population | http://id.esd.org.uk/metricType/3281 |
| Population density | http://id.esd.org.uk/metricType/176 |
| IMD: Overall - extent (%) | http://id.esd.org.uk/metricType/8985 |
| IMD: Health Deprivation and Disability - score | http://id.esd.org.uk/metricType/3906 |
| IMD: Living Environment Deprivation - score | http://id.esd.org.uk/metricType/3909 |
| IMD: Employment - score | http://id.esd.org.uk/metricType/3904 |
| IMD: Crime - score | http://id.esd.org.uk/metricType/3907 |
| IMD: Income Deprivation - score | http://id.esd.org.uk/metricType/3903 |
| IMD: Barriers to Housing and Services - score | http://id.esd.org.uk/metricType/3908 |
| IMD: Education Skills and Training Deprivation - score | http://id.esd.org.uk/metricType/3905 |
| IMD: IDACI - score (%) | http://id.esd.org.uk/metricType/4563 |
| IMD: IDAOPI - score (%) | http://id.esd.org.uk/metricType/4564 |
| % population aged 18 to 64 | http://id.esd.org.uk/metricType/2147 |
| % population aged 65 and over | http://id.esd.org.uk/metricType/2148 |
| % population aged 85 and over | http://id.esd.org.uk/metricType/3293 |
| Net current expenditure - all services (RS) | http://id.esd.org.uk/metricType/4103 |
| LAC substance misuse (%) | http://id.esd.org.uk/metricType/3135 |
| Under 18 conception rate (1,000) | http://id.esd.org.uk/metricType/688 |
| Under 25s attending specialist contraceptive services rate / 1,000 - Females | http://id.esd.org.uk/metricType/14866 |
| Under 25s attending specialist contraceptive services rate / 1,000 - Males | http://id.esd.org.uk/metricType/14867 |
| Hospital admissions for violence (including sexual violence) per 100,000 population | http://id.esd.org.uk/metricType/12022 |
| Chlamydia diagnostic rate / 100,000 | http://id.esd.org.uk/metricType/8168 |
| Genital warts diagnosis rate / 100,000 | http://id.esd.org.uk/metricType/8192 |
| Under 18s conceptions leading to abortion (%) | http://id.esd.org.uk/metricType/8175 |
| Under 25s having an abortion after a birth (%) | http://id.esd.org.uk/metricType/14857 |
| STI testing positivity (exc Chlamydia aged <25) % | http://id.esd.org.uk/metricType/8170 |
| Under 18s births rate / 1,000 | http://id.esd.org.uk/metricType/8190 |
| Genital herpes diagnosis rate / 100,000 | http://id.esd.org.uk/metricType/8191 |
| STI testing rate (exc Chlamydia aged < 25) / 100,000 | http://id.esd.org.uk/metricType/8178 |
| Gonorrhoea diagnosis rate / 100,000 | http://id.esd.org.uk/metricType/8162 |
| New HIV diagnosis rate / 100,000 | http://id.esd.org.uk/metricType/8187 |
| Abortions under 10 weeks (%) | http://id.esd.org.uk/metricType/8172 |
| Under 25s repeat abortions (%) | http://id.esd.org.uk/metricType/8173 |
| Over 25s abortion rate / 1,000 | http://id.esd.org.uk/metricType/14858 |
| % of mothers known to be smokers at time of delivery | http://id.esd.org.uk/metricType/12035 |
| Smoking Prevalence in adults - current smokers (APS) | http://id.esd.org.uk/metricType/10337 |
| % of adults (aged 18+) classified as overweight or obese | http://id.esd.org.uk/metricType/10709 |
| Obese children in reception year (%) | http://id.esd.org.uk/metricType/3333 |
| Obese children in year 6 (%) | http://id.esd.org.uk/metricType/3334 |
| % Overweight & obese in year 6 | http://id.esd.org.uk/metricType/888 |
| % Overweight & obese in reception year | http://id.esd.org.uk/metricType/889 |
| Healthy life expectancy at birth - male | http://id.esd.org.uk/metricType/3155 |
| Healthy life expectancy at birth - female | http://id.esd.org.uk/metricType/3156 |
| Life expectancy at birth - male | http://id.esd.org.uk/metricType/95 |
| Life expectancy at birth - female | http://id.esd.org.uk/metricType/96 |
| Disability-free life expectancy at birth - female | http://id.esd.org.uk/metricType/13692 |
| Disability-free life expectancy at birth - male | http://id.esd.org.uk/metricType/13693 |
| Fast food outlet rate per 100,000 population | http://id.esd.org.uk/metricType/10759 |
| Rate of referrals to children's social care per 10,000 | http://id.esd.org.uk/metricType/2226 |
| Referrals within 12 months of earlier referral (%) | http://id.esd.org.uk/metricType/2229 |
| Conception rate (1,000) | http://id.esd.org.uk/metricType/8211 |
| Fertility rate | http://id.esd.org.uk/metricType/3173 |
| Infant mortality per 1,000 live births | http://id.esd.org.uk/metricType/99 |
| Live births as percentage of population | http://id.esd.org.uk/metricType/519 (divided by total population and multiplied by 100) |
| % residents who are White | http://id.esd.org.uk/metricType/2123 |
| % residents who are Mixed/multiple ethnic groups | http://id.esd.org.uk/metricType/2124 |
| % residents who are Asian/Asian British | http://id.esd.org.uk/metricType/2125 |
| % residents who are Black/African/Caribbean/Black British | http://id.esd.org.uk/metricType/2126 |
| Total households on the housing waiting list at 31st March per 1,000 households | http://id.esd.org.uk/metricType/3484 |
| Children looked after rate, per 10,000 children aged under 18 | http://id.esd.org.uk/metricType/891 |
| % adults volunteering to support sport and physical activity at least twice in the last 12 months | http://id.esd.org.uk/metricType/10397 |
| Very bad health (%) | http://id.esd.org.uk/metricType/1971 |
| Mortality rate from a range of specified communicable diseases, including influenza (per 100,000) - male | http://id.esd.org.uk/metricType/12152 |
| Mortality rate from a range of specified communicable diseases, including influenza (per100,000) - female | http://id.esd.org.uk/metricType/12153 |
| Incidence of breast cancer (SRR) | http://id.esd.org.uk/metricType/3183 |
| Incidence of colorectal cancer (SRR) | http://id.esd.org.uk/metricType/3184 |
| Incidence of lung cancer (SRR) | http://id.esd.org.uk/metricType/3185 |
| Incidence of prostate cancer (SRR) | http://id.esd.org.uk/metricType/3186 |
| Incidence of cancer (SRR) | http://id.esd.org.uk/metricType/3182 |
| Hospital admissions per 100,000 for alcohol specific conditions - Females | http://id.esd.org.uk/metricType/12950 |
| Hospital admissions per 100,000 for alcohol specific conditions - Males | http://id.esd.org.uk/metricType/12951 |
| Percentage of people aged 17 years and over with diabetes | http://id.esd.org.uk/metricType/3699 |
| Suicide rate (per 100,000 aged 10+) | http://id.esd.org.uk/metricType/12156 |
| Rehabilitation (substance abuse) per 1000 people | http://id.esd.org.uk/metricType/10311 |
| Smoking Prevalence in adults in routine and manual occupations - current smokers (APS) | http://id.esd.org.uk/metricType/10346 |
| Routine occupations (NS-SeC %) | http://id.esd.org.uk/metricType/2087 |
| % of adults drinking over 14 units of alcohol a week | http://id.esd.org.uk/metricType/15585 |
| Emergency hospital admissions for COPD, 35+ yrs | PHE Profiles Indicator 92302 |
| Smoking attributable hospital admissions (new method), 35+ yrs | PHE Profiles indicator 93753 |
| Smoking Prevalence in adults (18+) - current smokers (APS), 18+ yrs, Never worked and long term unemployed | PHE Profiles indicator 92443 |
| Smoking Prevalence in adults (18+) - current smokers (APS), 18+ yrs, Routine and manual | PHE Profiles indicator 92443 |
| Smoking Prevalence in adults (18+) - current smokers (APS), 18+ yrs, All occupations | PHE Profiles indicator 92443 |
| Smoking prevalence in adults (18+) admitted to treatment for substance misuse (NDTMS) - alcohol, | PHE Profiles indicator 93674 |
| Smoking prevalence in adults (18+) admitted to treatment for substance misuse (NDTMS) - alcohol & non-opiates, | PHE Profiles indicator 93675 |
| Smoking prevalence in adults (18+) admitted to treatment for substance misuse (NDTMS) - all opiates, | PHE Profiles indicator 93672 |
| Smoking prevalence in adults with a long term mental health condition (18+) - current smokers (GPPS), | PHE Profiles indicator 93454 |
Annex B: Full summary of the final regression models
The following table displays the full results of the five final regression models, including specific regression coefficients.
A regression coefficient indicates the direction and “steepness” of the relationship each explanatory metric has with the particular rate of expenditure. A negative coefficient indicates that increasing levels of the metric are associated with decreasing spending rates and decreasing levels of the metric are associated with increased spending rates, whilst a positive coefficient indicates that the metric and the spending rate increase or decrease in line with each other.
As all the metrics were standardised before being tested, all of the coefficients in the table are comparable with one another; a larger coefficient indicates a stronger degree of association or influence than a smaller coefficient. The Adjusted R Squared statistics are those interpreted in the main body of this report as “percentage of variation explained”, as they indicated the proportion of variance in the spending rate which can be predicted based on the collective set of variables present in the statistical model.
These coefficients demonstrate that the metric with the strongest effect of increasing spending rates was the Income Deprivation Affecting Children Index (IDACI), in its relationship with the spending rate on 0-5 services. Close behind it is the average diagnosis rate for sexually transmitted infections (STIs) in its effect on the overall spending rate, and the rate of children looked after per 10,000 in its effect on the drugs and alcohol spending rate. The metric with the strongest effect of decreasing spending rates was life expectancy at birth, in its effect on the smoking spending rate, with its influences on the overall and 0-5 services spending rates not far behind.
| Overall public health | Drugs and alcohol | Obesity | Services for 0-5 year olds | Smoking
|
|
|---|---|---|---|---|---|
|
Adjusted R Squared |
0.759 |
0.559 |
0.259 |
0.578 |
0.128 |
|
Index of Multiple Deprivation (IMD) Overall |
0.270 |
Not in model |
Not in model |
Not in model |
Not in model |
|
IMD Living Environment Deprivation |
Not in model |
Not in model |
0.312 |
Not in model |
Not in model |
|
IMD Income Deprivation Affecting Children Index (IDACI) |
Not in model |
Not in model |
Not in model |
0.518 |
Not in model |
|
Life expectancy at birth (avg. of male and female) |
-0.285 |
Not in model |
Not in model |
-0.315 |
-0.368 |
|
Healthy life expectancy at birth (avg. of male and female) |
Not in model |
-0.283 |
Not in model |
Not in model |
Not in model |
|
Disability free life expectancy at birth (avg. of male and female) |
Not in model |
Not in model |
-0.262 |
Not in model |
Not in model |
|
Hospital admissions per 100,000 for alcohol specific conditions (avg. of male and female) |
Not in model |
0.175 |
Not in model |
Not in model |
Not in model |
|
Rehabilitation (substance abuse) per 1,000 people |
Not in model |
0.137 |
Not in model |
Not in model |
Not in model |
|
Average diagnosis rate for STIs |
0.455 |
Not in model |
Not in model |
Not in model |
Not in model |
|
Children looked after per 10,000 |
0.277 |
0.428 |
Not in model |
Not in model |
Not in model |
|
Under 18 births rate per 1,000 |
Not in model |
Not in model |
-0.251 |
Not in model |
Not in model |
|
Obese children in year 6 (%) |
Not in model |
Not in model |
0.371 |
Not in model |
Not in model |
|
% of residents who are Asian/Asian British |
Not in model |
Not in model |
-0.275 |
0.137 |
Not in model |
|
Total population |
-0.105 |
Not in model |
-0.153 |
Not in model |
Not in model |