Place based approaches for addressing health inequalities, material developed by the LGA and Public Health England.
Introduction
‘Place Based Approaches for Reducing Health Inequalities’ (PBA), describes the Population Intervention Triangle (PIT) as a model for planning collaborative action to reduce health inequalities. The PIT brings together a number of important constituent elements which together form the main elements of effective place-based working. It was developed through practical experience working to achieve measurable population level change in health and wellbeing outcomes, including addressing health inequalities between and within local geographies.
Population Intervention Triangle
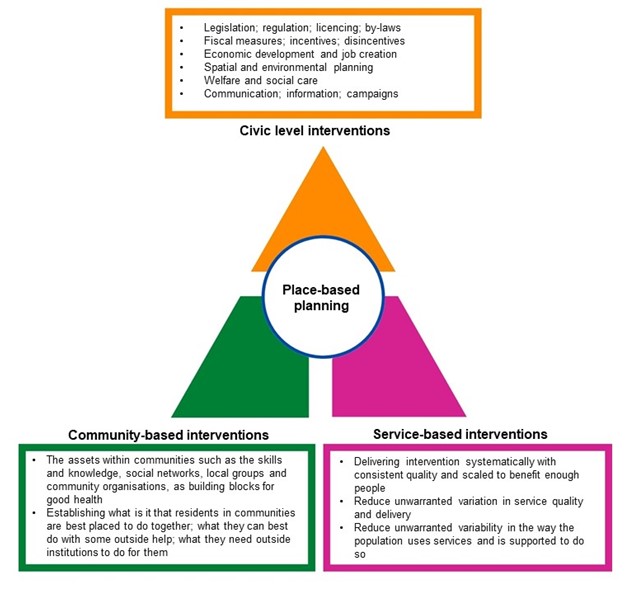
Diagrammatically, the Population Intervention Triangle is composed of three similarly sized coloured segments. These represent three different types of input within a Place that can have a measurable impact on population health outcomes.
- The top part of the triangle, in orange, represents Civic-level interventions. These largely originate from town halls and city halls and can potentially influence and impact on all residents in the Place. An accompanying orange bordered rectangle lists examples of this type of intervention.
- The green, left-hand part of the triangle’s base represents Community-based interventions. These are elements within the communities themselves that can support community members to improve their own health and wellbeing. Some description of these elements is given in the associated, green-bordered rectangle
- The purple right-hand part of the triangle’s base represents Service-based interventions. Delivering evidence-based services to individuals, consistently and effectively, with scale, can add up to make a measurable difference at population level as well. An associated, purple-bordered rectangle describes a little more detail about how this works.
Each of the elements represented by the three segments of the triangle in the diagram can, if delivered effectively, make their own impact on population health and wellbeing. However, the overall impact can be much greater if the input from those segments is coordinated into coherent policies and strategies.
- The blue-bordered circle at the centre of the triangle diagram represents this as Place-based planning.
PBA sets out that whilst each of the three sectors on their own can have an impact on differences in health outcomes, when these sectors act together with system, scale, and sustainability, their combined efforts can produce proportionately much greater measurable improvements in population level outcomes.
The toolkit
This toolkit provides practical resources that individuals, organisations, places, and systems can use to identify the breadth and depth of their collaborative action on health inequalities. It consists of four maturity index tools including:
- tool A: Place Based Planning: through joined up leadership, meaningful partnership and shared policies and strategies
- tools B, C, and D: Working together effectively across the interfaces and ‘functional seams’ between sector.
Place Based Approaches: Population Intervention Triangle (PIT) Toolkit Schema
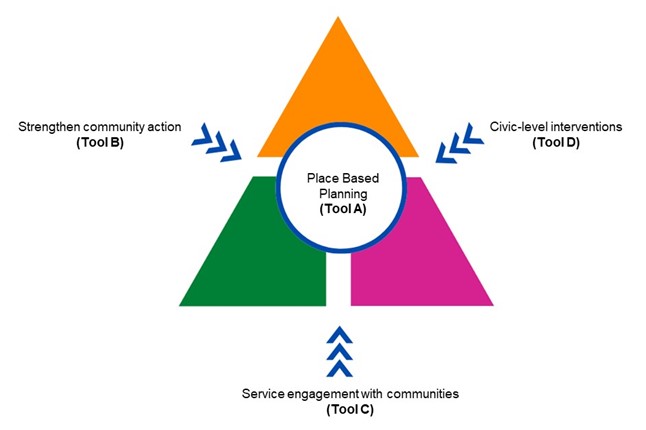
This PIT toolkit Schema diagram builds on the previous one.
At the centre of the triangle, as before, there is a blue-bordered circle representing Place-based planning. This is the focus of Tool A, which is described in detail in this Toolkit.
The diagram this time also highlights the three interfaces between the coloured segments, each shown with a triple-headed arrow. These interfaces, or ‘seams’ within the triangle are important areas of focus. Putting attention and energy into how the segments can best interact across the seams can potentially make the whole impact of the PIT greater than the sum of its parts. Each of these can be supported by using the separate Tools included in this resource.
- Tool B explains how civic-centred inputs can strengthen community action.
- Tool C examines how best service engagement with communities can work to reduce barriers and gaps.
- Tool D is about optimising the way civic- service integration can add value and impact for example with healthcare.
All of the material making up the content of the four Tools is strongly derived from extensive experiential learning.
An evaluation of the PBA has demonstrated that local systems have found the tools useful in supporting cross-system planning and action to reduce health inequalities.
How to use the tools
PBA tools have been developed to support cross-system, place-based working. The tools will:
- help individuals to assess where they think their partnership is on the maturity index
- provide the basis for strengthening collaboration and or joint strategy development/action planning (0.5 - 1 day), through a facilitated workshop
- help develop mutual understanding of current position on health inequalities, for example as part of a wider board or partnership session (2 hours)
- provide an online self-assessment tool, which can be carried out by all partners forming the basis of future workshop planning (flexible).
Users are recommended to start their assessment using Tool A - Place Based Planning, which will help to determine the maturity of local arrangements to address health inequalities. Following this, users can select additional tools based on local partnership priorities (the tools can also be adapted to support single agency or topic-based work as required).
All four Tools comprise ten domains identified as critical to that component of place-based working. The Tools are structured as matrix tables, which start with a series of statements across the 10 domains on the vertical axis. The horizonal axis is a grading sequence running from the baseline ‘emerging’ (white) through to ‘developing’ (bronze), ‘maturing’ (silver) and ‘thriving’ (gold).
For each of the 10 domains, there are a series of statements that provide a description of what will constitute that level of development, with the descriptors getting progressively stronger from left to right in the row.
Users of the matrix are then able to move down from domain to domain, row by row, deciding which of the descriptors most closely fit the situation in which they are currently working. The appropriate cell can then be marked or ringed before moving down to the next row. The overall result for the matrix can then be recorded in a scoresheet as appropriate, (examples can be seen following each of the Tools in the Appendix) providing a record that enables individuals and single organisations to gain insight. An individual, such as a programme manager or peer-reviewer can produce a record sheet for their own use. However, in a workshop setting a composite record of a number of exercise participants can be brought together as the basis of discussion, as described below.
Using the tools in a group or workshop context
Key prompts and questions for a group or workshop situation:
- to what extent do partners agree or disagree about the current position on each of the domains?
- where there is significant difference, what is the basis of the disagreement? Is this an individual or a sectoral/organisational view?
- what change, action, evidence or input would help to achieve greater consensus?
- what action or commitment is required to move across the matrix to progress to the next level of development?
- what action is required and by whom to operationalise the next steps, and in what timescale?
- how should progress be measured?
Key features of effective workshops (based on previous pilot phase of PBA Implementation)
- participants should be drawn from civic/public sector, voluntary community and social enterprise (VCSE) sectors, and health and care services. Opportunity should be created for participants to work together on small tables or breakout groups with a mix of partners
- sufficient time for discussion should be allowed to enable creative exploration of different participant perspectives.
Brief workshop format
- introduction to the Tool and its use
- individuals given 5 – 10 minutes to mark up the matrix sheets, highlighting best fit to their perspectives
- table groups facilitated to collate their scores and then discuss reasons for differing perspectives (30 - 40 minutes)
- refreshment break while facilitators pool small table collated scores
- facilitated Plenary explores where there is consensus, and where perspectives differ, and
- consequences and next steps (50 – 60 minutes).
Appendix
Tool A: Place Based Working
Tool B: Civic support to Communities
Tool C: Service support to Community
Tool D: Civic to Service Integration
Tool A: Place Based Working
|
|
Emerging (1) |
Developing (2) |
Maturing (3) |
Thriving (4) |
|
Leadership |
Health Inequalities (HI) described as a principle, with little practical integrated action, commitment of resource, programme support or top table monitoring. |
Organisation level HI priorities accommodated in partnership discussions. Ambitions incorporated into overarching vision, but missing or weak co-ordinated practical action. |
Organisational HI champions recognised and used. Some co-ordinated action accommodated in system plans. Need for systematic application and appropriate scale acknowledged in business plans. |
System leadership is fully committed to and owns HI as a local priority, and integrates vision, strategy and action plans into other priorities as a matter of course in place-based approach. |
|
Needs Assessment
|
JSNA continues to be updated and driven by HWB as a statutory function, but STP/ICS and CCG related action based on unlinked NHS sources (NHS Digital; RightCare). |
Partnership analysts combine to draw on main sources and data products to produce a comprehensive integrated statistical foundation for joint planning. |
Qualitative information from communities combined with ‘top-down’ data to create a recognised ‘picture of place’. Profile extends to localities; neighbourhoods; GP clusters. Implications from analysis considered. |
Community assets as well as needs mapped, and constructively considered as part of planning. Audits assess how priorities agreed link back to intelligence base, and systems adjusted. |
|
Prioritisation
|
HI agenda crowded out by other priorities. Aggregation of fragmented agendas of different partners. No clear appreciation of HI impact with limited consultation. |
Partners propose jointly agreed vision and ambition for change, based on shared analysis, benchmarking and interpretation. Covers short, medium, long-term change. |
Joint priorities acknowledge how action on HIs integral to other main agendas. Graded action proposed based on need. Organisation- based public consultation. |
Joint consultation with communities on a place / community of identity basis. Joint HI priorities track forward as ‘golden thread’ to constituent organisational plans. |
|
Scoping Whole System
|
HI strategies and plans add together interventions making up existing actions of partners which might contribute to agreed priorities. |
A ‘desk-based’ review of evidence by a technical team (e.g. NICE; PHE; LGA) provide a catalogue of possible interventions to address agreed joint priorities for consideration and proposal. |
Partners representing expertise from the three ‘segments’ of the Population Intervention Triangle contribute possible interventions within their functions as part of a long-list for joint consideration. |
Joint considerations include how interventions might combine more effectively (and efficiently) across the segment interfaces (‘seams’), so the whole can be greater than the sum of the parts. |
|
Intervention Selection
|
Aggregation of some possibly relevant interventions collated, but unclear if consideration given to systematic application; scale; or sustainability of approach. |
Clear criteria for change at population level used to select options. Modelling used to assess whether desired dimensions of change possible.
|
Assumptions on possible options for change clearly laid out, separately and in combination. Gestation for delivery of outcomes realistic. |
Widespread, transparent consultation on portfolio of suggested interventions. Clear contributions needed by partners stated and agreed.
|
|
Target Setting
|
Ambitions stated for addressing HIs, but without setting realistic targets based on firm plans. |
Targets based on appropriate benchmarking, and match agreed joint priorities. Built on analysis of trends and modelling. |
Interventions deliverable at scale with credible timescales. Resourcing realistic. Measurable local indicators of progress. |
Clearly stated equitable distribution of benefit being monitored. Measures translated to be meaningful to a wider audience. |
|
Business Planning
|
No business planning in place or those that do have unrealistic assumptions and outcomes. |
Financial case made based on outcomes not just savings. Costs and impacts counted across the partners, not just single organisations. |
Credible assumptions made about funding necessary scale, capacity and consistent delivery of standards. Sustainable funding over target period. |
Plans provide graduated resourcing according to need. Cost of not investing also considered. |
|
Information Governance
|
Data sharing between partners negotiated on a case-by-case basis. Quality of Information Governance patchy across systems. |
Data sharing policies and protocols agreed amongst key partners in principle. Some barriers remain in practice. |
Confidence in consistent standards of governance amongst partners. Working to remove IT barriers. Joint Communication strategy. |
Connectivity of IT effective in reducing barriers to integrated work. Sharing supports useful monitoring and evaluation. |
|
Programme Management
|
Contributory actions to agreed priorities reported separately by organisation or sub-group on intermittent basis. Health inequalities addressed separately. |
Health inequalities addressed across mainstream priority programmes. Organisation based actions with some cross-cutting themes. |
Combined infrastructure to deliver joint programmes. Pooling of resources. Clear dissemination of updates and reports, decisions taken, and who has authority for what. |
Joint funding. Dedicated, cross organisation programme manager responsible for reporting to Board, and empowered to mitigate problems with progress. |
|
Evaluation
|
No planned evaluation at outset. |
Monitoring with planned review and reporting periods. Detailed ‘deep dive’ scrutiny at high level committee or Board during/end of plan period. |
Plan; Do; Study; Act approach drives progress with reflective, disseminated learning to adjust structures, processes and intermediate outcomes behind plan. |
Plan for independent evaluation during and at end of programme period. Investigators appointed from start with baselines established. |
Tool A: Workshop Collation Sheet
Scoresheet to collate individual perspectives into a composite picture: partners will have separately assessed their view of the local setup, selecting the statement in each row of the matrix that most closely describes their perspective. Their responses can be collated here, to form the basis of constructive discussion of the varying perspectives.
This will lead on to discussion of what it would take to align the perspectives towards a common position. Subsequently, the next step would be to prioritise actions to move the consensus position on to strengthen grading of the elements as appropriate.
|
|
Leadership |
Needs Assessment |
Prioritisation |
Scoping Whole System |
Intervention Selection |
Target Setting |
Business Planning |
Information Governance |
Programme Management
|
Evaluation |
|
Emerging (1) |
|
|
|
|
|
|
|
|
|
|
|
Developing (2) |
|
|
|
|
|
|
|
|
|
|
|
Maturing (3) |
|
|
|
|
|
|
|
|
|
|
|
Thriving (4) |
|
|
|
|
|
|
|
|
|
|
|
Consensus (1-4) |
|
|
|
|
|
|
|
|
|
|
|
Proposed Priorities for Action Discussed |
|
|
|
|
|
|
|
|
|
|
Tool B: Civic support to Communities
|
|
Emerging (1) |
Developing (2) |
Maturing (3) |
Thriving (4) |
|
Involving |
||||
|
Community leadership and representation
|
Community involvement in civic infrastructures is patchy, unrepresentative, and largely unsupported. |
Membership of some key committees, e.g. Health and Wellbeing Board, provides channels linking to main protected equity groups. |
Varied community representation. Training to support effective functioning in committees given to community reps; also to committee staff to enhance reps participation and feeling of being valued. |
Active channels supported to assist active two-way communication between representatives, the groups they represent and the wider community. |
|
Promotion of active citizenship
|
Unclear which civic decisions people in local communities can influence, and how. |
Some evidence of the system valuing and sharing knowledge, skills, and experience of community members and VCSE partners. |
Culture of routinely adopted good practice to make it easy as possible for community members and those from VCSE organisations to get involved in civic action. |
Community involvement in civic processes audited and evaluated. Impact fed back and examples publicised widely to encourage others. |
|
Graduated community support
|
No apparent priority given or strategic approach consulted on to address need for community development. |
Civic approach to community support and development reactive, not proactive and planned. |
Explicit strategy ensures intensity of support to community development (CD) targeted proportionate to greatest needs and barriers. |
Evidence that support to communities initially lacking leadership, infrastructures and resources has improved their capacity, capability, and engagement. |
|
Community needs mapped
|
No formal recognition of ‘natural communities’. Local profiles based only on ‘top down’ statistical analysis. |
Neighbourhood profiles augmented with some ‘bottom-up’ qualitative input from residents and frontline staff. |
Needs, assets and preferences gathered systematically through community centred research. Priorities agreed through discussion. |
Intelligence based segmentation of communities to align approaches and share learning. |
|
Scaling |
||||
|
Investment in infrastructure
|
No place-based strategy or resources to provide infrastructures to support community-centred approaches. |
Some designated civic staff allocated specific time, resources, and support specifically for community engagement. |
Broader culture embraces two-way process with realistic time, effort and resources invested to build trust and relationships at all system levels e.g. ward, council, ICS. |
Dedicated and integrated resources for outreach and advocacy to engage the most marginalised and achieve co-production. Balance of appropriate face-to-face and online methods.
|
|
Building on community assets
|
Little recognition of existing local partnerships and networks within communities before initiatives planned. |
Initiatives draw on knowledge and experience of communities and VCSEs to identify and recruit people to represent local needs and priorities and commission community-centred approaches. |
Existing infrastructures and networks reviewed against the ‘family’ of community-centred approaches. Plans to work on relevant gaps towards desired outcomes. |
Having identified community assets and facilities, strategies incorporate engagement with them and how they might be developed with their community. |
|
Strengthening |
||||
|
Learning and training initiatives
|
Learning and training initiatives around community engagement and development are haphazard, with little overall strategy. |
Training and mentoring for staff working with communities aims to systematically provide knowledge, understanding and skills relevant to CD and community-centred practice. |
Social networks and forums help to continually share learning and experience within and between local communities, voluntary organisations, and statutory sector staff groups. |
Planned learning, skills development and support for community participants. Training for community champions and volunteers. Joint training with statutory sector staff. |
|
Financial support to VCSE sector
|
No substantial, explicit Civic commitment to build up the VCSE sector. |
Work in partnership with community groups to identify funding requirements and sources of funding. Support available for funding applications. |
Provision of direct grants and commission services with levers based on Social Value Act to expand sector involvement. Targets set for VCSE as providers of services. |
Funding measures account for: recruitment; training; ongoing support; development opportunities and supervision of volunteers. Expenses paid so volunteers not out of pocket. |
|
Sustaining |
||||
|
Monitoring and evaluation
|
No real joint engagement of VCSE sector members with those supporting and funding them in setting up monitoring and evaluation frameworks. |
Community members and VCSE organisations involved in planning, designing, and implementing evaluation frameworks including objectives. |
Good evaluation methods include qualitative and quantitative methods; capture varied information, including: What works? In what context? Costs? Experiences? Community determinants of health? |
Regular feedback provided on positive impacts of engagement and issues of concern. Learning documented and recorded to improve future principles of joint working. |
|
Coherent Civic Commitment
|
Community support has been patchy and not part of a systematic plan. Tends to respond to communities that push themselves forward. |
Community capacity building stated as an important end goal, working to improve strength, resilience, health and wellbeing. |
Operationalised inputs commit resources and mechanisms for intervention. Supportive culture, attitudes and practice embedded in Local Authority environment. |
Plans realistic, recognising time needed to build relationships, trust, commitment, leadership, capacity and integrated approach across organisations. Systematically scaling up community centred approaches. |
Tool B: Workshop Collation Sheet
Scoresheet to collate individual perspectives into a composite picture: partners will have separately assessed their view of the local setup, selecting the statement in each row of the matrix that most closely describes their perspective.
Their responses can be collated here, to form the basis of constructive discussion of the varying perspectives. This will lead on to discussion of what it would take to align the perspectives towards a common position. Subsequently, the next step would be to prioritise actions to move the consensus position on to strengthen grading of the elements as appropriate.
|
|
Community leadership and representation |
Promotion of active citizenship |
Graduated community support |
Community needs mapped |
Investment in infrastructure |
Building on community assets |
Learning and training initiatives |
Financial support to VCSE sector |
Monitoring and evaluation |
Coherent civic commitment |
|
Emerging (1) |
|
|
|
|
|
|
|
|
|
|
|
Developing (2) |
|
|
|
|
|
|
|
|
|
|
|
Maturing (3) |
|
|
|
|
|
|
|
|
|
|
|
Thriving (4) |
|
|
|
|
|
|
|
|
|
|
|
Consensus (1-4) |
|
|
|
|
|
|
|
|
|
|
|
Proposed Priorities for Action Discussed |
|
|
|
|
|
|
|
|
|
|
Tool C: Service support to community
|
|
Emerging (1)
|
Developing (2) |
Maturing (3) |
Thriving (4) |
|
Prioritisation and Targeting
|
Priority for resources based purely on community ability to self-promote, or strong champions in positions of influence. |
Communities in greatest need identified with ranked objective measures e.g. deprivation scores: IMD or part domains such as housing; income; education; health. |
Ranking augmented by shortlist of target communities constructed by consideration of detailed assessment of relative needs and assets, and benchmarking of key service outcomes. |
Overarching strategy with plans to provide graduated attention and support based on relative need over time: most disadvantaged to move the furthest fastest. |
|
Defining communities
|
Communities primarily defined based on LSOA; MSOA etc. for ease of analysis. Range of overlapping service boundaries exist. |
Electoral wards adopted as a common currency of place-based working across services |
Neighbourhood and cultural communities self-defined through consultation with residents. Lower Super Output Areas (LSOAs), Middle Super Output Areas (MSOAs) clustered to fit. |
Public sector service organisational boundaries co-terminus and built-up taking account of communities and community infrastructure |
|
Practical asset mapping
|
Little account taken of community assets or locally identified deficits. Barriers in top-down Place-based planning |
Large detailed stocktake of assets compiled with external support and held electronically as a shared resource. Not maintained and may be out of date. |
Useful database kept systematically updated by partners, with shared resource. Easy to access and use by staff and public. Drives a range of informative products and access points. |
Real-time knowledge of key assets (e.g. local leaders; well used community venues and infrastructures) are shared systematically by working partners/community leads. |
|
Community-based perspectives
|
Community perspectives to influence service engagement depends on consultation on plans with formal representatives at certain stages. |
Externally commissioned and delivered review of community perspectives based on academic or market research principles. Feedback at community event. |
Participatory research based on training and support of community-based researchers (CBR) as peer led assessment of needs; wants; barriers and aspirations. |
CBRs feedback findings into community. Help inform/own compilation and analysis of results and explore and test out ideas for action. Continue to monitor ongoing perceptions as work streams progress. |
|
Shared Community Profiles
|
Community/ward/practice profiles only constructed as a statistical sub-set of the strategic needs assessment. |
External sources of non-attributable data collated with qualitative input from residents, including as participatory research, and frontline staff. |
Emerging picture described, communicated, discussed and modified accordingly after community debate to present a working ‘picture of place’ recognisable to them. |
Arrangements to ensure ongoing work-streams keep the intelligence ‘topped up’, adding increasing layers of local insight to the picture.
|
|
Neighbourhood action plan
|
A range of community focussed goals and actions established separately by different external stakeholders. |
Coordinated action plan established, taking some account of goals based on community’s own priorities. |
Realistic community owned goals central within local plans, with clear visible outcomes to reinforce their confidence in ability to make changes. |
Agreed contributions of community and external stakeholders clear. Formal mechanisms to take stock of adherence to mutually agreed principals of behaviour. |
|
Co-ordinated partner behaviour
|
External organizations across the sectors continue to work into priority communities in largely uncoordinated initiatives. |
Inter-agency processes for integrated systems of communication and safe information sharing, reducing duplication and transaction costs. |
Modified working practices and structures produce ‘collaborative plumbing’ e.g. personalised care plan; shared key worker; unified case management. |
Integrated systems put individual and family users at the centre of holistic decision making and setting priority goals. |
|
Outreach and in-reach models
|
External organizations provide services from a range of estates and points of access: some local, some from distance, each with different entry points. |
Service provision options chosen from a variety of public sector/community venues locally, so users feel safe and reassured when seeking support. |
Local negotiation supports single points of local access, both face-to-face and digital to help address a multifaceted range of problems. |
Peer workers recruited, trained and supported to provide an intermediary workforce, reducing cultural barriers to access and use. |
|
Linking to the disengaged/excluded
|
Some residents deemed stigmatised or not worthy of support by community (criminal past; addictions; street workers} and are excluded or exclude themselves. |
Public and Voluntary and Community and Social Enterprise (VCSE) sector service front-line workers trained in (health) coaching and activation skills. |
Designated support workers link to excluded groups e.g. homeless. Peer support workers / community champions adding signposting, referral, and advocacy to receptive services, from one remove. |
Targeted outreach to isolated / excluded groups. Credible first contact establishing trust, backed with multifaceted support options. |
|
Transfer to community ownership
|
Independent sector community-based activities subject to conventional commissioned oversight; performance; management financial controls. |
Some mainstream service delivery prioritises development of locally developed and recruited peer workforce for appropriate roles. |
Some community centred roles developed by, or transferred to community ownership, e.g. as social enterprise, community interest company etc. |
Ongoing external expert development and support continues, but there is significant transfer of resources, control, and responsibilities. |
Tool C: Workshop Collation Sheet
Scoresheet to collate individual perspectives into a composite picture: partners will have separately assessed their view of the local setup, selecting the statement in each row of the matrix that most closely describes their perspective.
Their responses can be collated here, to form the basis of constructive discussion of the varying perspectives. This will lead on to discussion of what it would take to align the perspectives towards a common position. Subsequently, the next step would be to prioritise actions to move the consensus position on to strengthen grading of the elements as appropriate.
|
|
Prioritisation and targeting |
Defining communities |
Practical asset mapping |
Community-based perspectives |
Shared community profiles |
Neighbourhood action plan |
Co-ordinated partner behaviour |
Outreach and in-reach models |
Linking to the disengaged/ excluded |
Transfer to community ownership |
|
Emerging (1) |
|
|
|
|
|
|
|
|
|
|
|
Developing (2) |
|
|
|
|
|
|
|
|
|
|
|
Maturing (3) |
|
|
|
|
|
|
|
|
|
|
|
Thriving (4) |
|
|
|
|
|
|
|
|
|
|
|
Consensus (1-4) |
|
|
|
|
|
|
|
|
|
|
|
Proposed Priorities for Action Discussed |
|
|
|
|
|
|
|
|
|
|
Tool D: Civic to Service Integration
|
|
Emerging (1) |
Developing (2) |
Maturing (3) |
Thriving (4) |
|
Integrated Planning Structures
|
Priorities emerge from vision and strategy of place-based partnership, but without formal structure or process to develop plans |
Champions with specialist interest from different organisations and across sectors discuss possible ways forward, and take back for internal consideration |
Joint proposal draws together contributions from a range of partners to be delivered through aligned, but separate actions, working towards agreed common goals/ outcomes in priority areas |
Joint specific planning group with named senior responsible officer, dedicated capacity to support delivery, agreed outcomes, milestone plans and monitoring and evaluation. Reports, and held to account by, system wide partnership. |
|
Information Sharing |
Partners perceive value of information sharing and joint analysis (population health, community, service, mental health, operational etc) but held back by actual or perceived barriers |
Data and information in the public realm is shared between organisations. Information Governance (IG) training and systems remain solely within individual agencies. Caution and lack of trust persists between partners. Shared analysis with anonymised data |
Negotiated and agreed shared policies and protocols signed up to. Training in IG and safety mandated and effectively delivered across the partnership workforce, with some joint training. Public realms data and intelligence jointly owned and presented |
Technical connectivity, integrated IT reliably facilitates communication and timely, safe transfer of intelligence. Arrangements for joint analysis and agreement of interpretation in key areas.
|
|
Joint Commissioning and Procurement |
Individual siloed service commissioning in each service sector |
Commissioners meet cross-system to share plans and consider early scoping of proposals |
Formal mechanism for joint commissioning in place Including integrated market analysis, service specifications; etc. across pathways |
Integrated plans to deliver shared outcomes. Arrangements help align/pool resources (budgets; workforce; procurement systems) |
|
Delivering Integrated Pathways |
Integration of inputs along pathways and functions without clear governance, or mechanisms for managing decision making, disputes and resourcing issues arise |
Lines of communication, support and accountability negotiated and defined across participating agencies, and are clear to staff through policies and standard operating process |
Joint organisational development on an ongoing basis, creates cultural understanding, strong shared ownership and belief in common principles and practice
|
Clear working governance and assurance mechanisms in place across agencies and within integrated pathways/shared services. Quality and safety driven and owned by cross-system professional leaders. |
|
Multifaceted inputs to meet complex needs |
Individual agency support accessed through an asset / service directory. May be facilitated by connectors e.g., social prescribing. link workers; Connected Care |
Single Point of Access provides facilitated access to a range of civic, health and social support services including public and VCFSE sectors |
Holistic needs assessment systematically available to scope complex issues that need support. Referral facilitated to necessary agencies including jointly funded VCSE where appropriate |
Joined-up multi-service/sector inputs co-ordinated as a person-centred strength- based plan (food; income and debt; housing or job insecurity; legal) alongside clinical/social care plan |
|
Services Preventing Ill-Health |
Individual agency commissioned prevention services addressing specific health risks |
Jointly commission some prevention services through LA/PH and NHS policies and programmes. Links across may be patchy and variable. |
Coherent multi-agency plans to address specific programmes of work and levels of need e.g., falls prevention; drawing together service, civic and community led interventions and jointly managed across agencies
|
Cross-system population health management approach with evidence informed and strength based targeted and tailored prevention programmes. Interventions are delivered at individual and community level drawing together service, civic and community assets, resources, support etc |
|
Focus on client/user goals and priorities |
Single organisation care planning. Agencies aware of others involvement but care plans are not joined up and may not be focussed on clients own goals |
Individual care plans in place but frontline services are able to cross-refer easily. Actions avoid duplication in assessments and potential conflicts and confusion over care plans |
Joint assessments and shared care plans and information between agencies, based on user involvement and goals. Actions jointly monitored across agencies. |
Integrated strength- based plans and goals established and monitored with user. Key worker agreed for multi-faceted inputs. Consistency of user-facing process and language. |
|
Factoring in social value and sustainability |
Social value not really considered through the commissioning cycle, or reflected and embedded alongside other priorities e.g., health inequalities |
There are ad hoc examples of where procurement approaches and organisational practice secure added social value with increased benefits for the local economy, |
Social value assessment tools are systematically used to inform and assess added social value as part of procurement and organisational practice and processes. . |
Organisations set joint system targets for social value, using their purchasing power to have a greater impact on the conditions in which people live, affecting power, money, and sustainability of resources. Social value is harnessed across the system and targeted to support achievement of health inequalities goals |
|
Cross system workforce transformation
|
Some initiatives support closer joint working, but do not address issues of organisational cultural differences, and internal governance |
Local teams meet regularly to resolve problems and concerns and share reflective learning. Work through possible barriers of technical jargon and definition |
Examples of shared approaches to workforce development, including joint training across organisations and professions. Includes leaders; middle managers and frontline staff. |
Systematic approach to workforce development, including single cross system workforce development plan, joint training, and shared opportunities for learning and reflection within an evaluation framework. |
|
Inspection, regulation, and governance |
Change to more integrated pathways impeded by concerns about differences and perceived inflexibility in inspection and regulation |
Local systems and processes for joint commissioning provide oversight of desirability and acceptability of change with respective partner Boards |
Organisations regularly test cross-sectoral elements of plans with professional/ practitioner bodies and take legal advice as plans develop. |
Inspection and regulation systems brought ‘onside’ from the outset. System works with them to ensure governance and risk management acceptable. |
Tool D: Workshop Collation Sheet
|
|
Integrated planning structures |
Information sharing |
Joint commissioning and procurement |
Delivering integrated pathways |
Multi-facet inputs for complex needs |
Services preventing ill-health |
Focus on client/user goals and priorities |
Factoring in social value and sustainability |
Cross system workforce transformation |
Inspection, regulation and governance |
|
Emerging (1) |
|
|
|
|
|
|
|
|
|
|
|
Developing (2) |
|
|
|
|
|
|
|
|
|
|
|
Maturing (3) |
|
|
|
|
|
|
|
|
|
|
|
Thriving (4) |
|
|
|
|
|
|
|
|
|
|
|
Consensus (1-4) |
|
|
|
|
|
|
|
|
|
|
|
Proposed Priorities for Action Discussed |
|
|
|
|
|
|
|
|
|
|