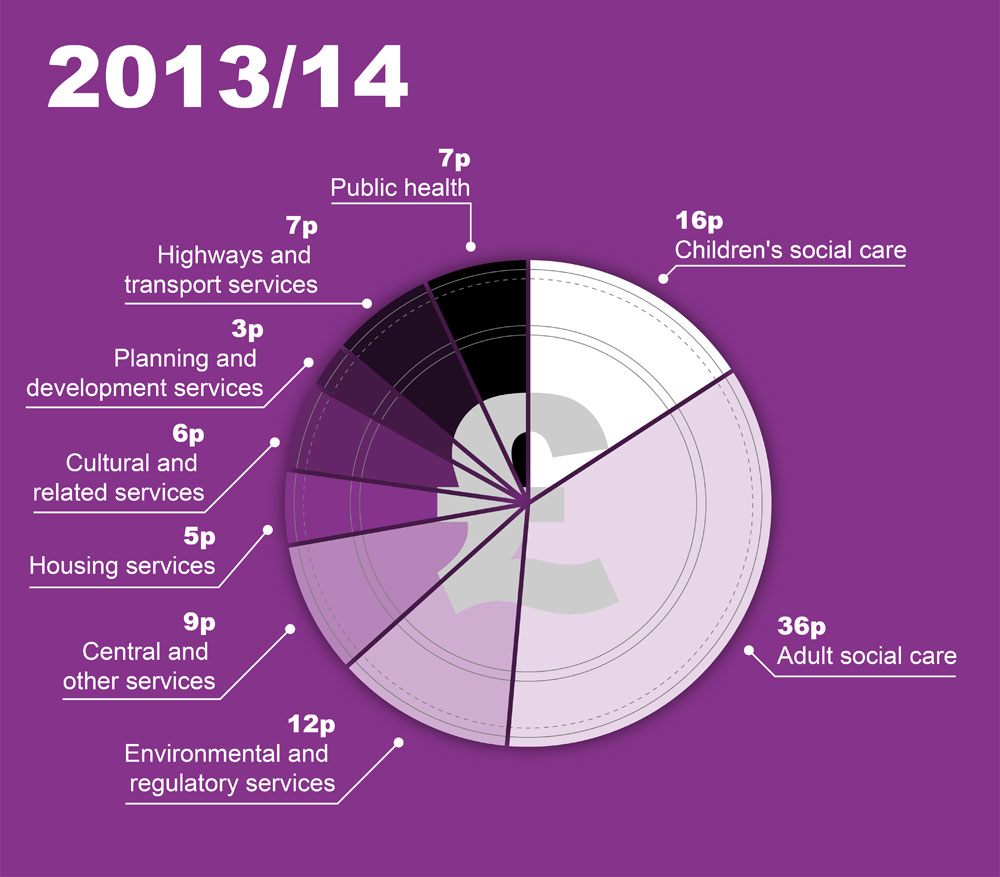
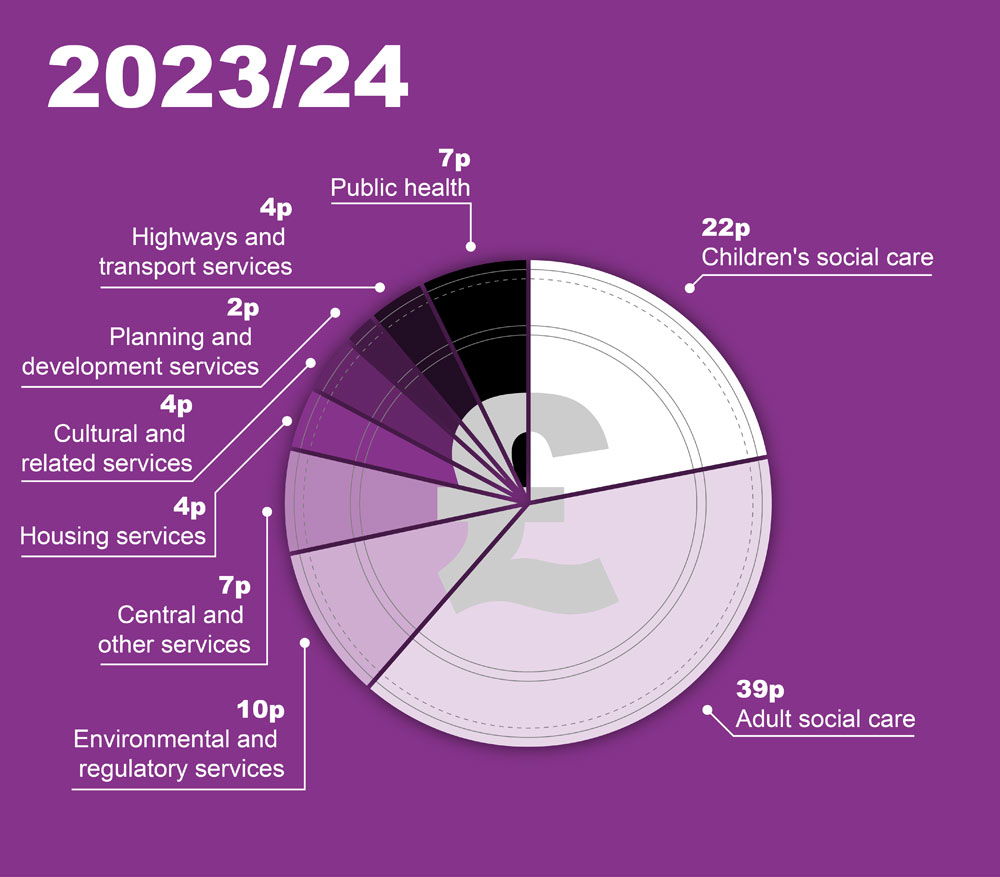
Council spend is increasingly concentrated in fewer services and on fewer people.
Councils provide hundreds of services in your area, but funding cuts and growing service demand means that council spend is increasingly focused on social care. In 2023/24 less than 40 per cent of councils’ total spend was left for services such as street cleaning, waste collection and leisure centres.
Source: LGA analysis of Revenue Account budget data published by the Department for Levelling Up, Housing and Communities (DLUHC) and population projection data published by the Office for National Statistics (ONS).
Source: LGA analysis of Revenue Account budget data published by the Department for Levelling Up, Housing and Communities (DLUHC) and population projection data published by the Office for National Statistics (ONS).
Data is included for councils only. This includes London borough councils (including the City of London), metropolitan district councils, shire county councils, shire district councils, and shire unitary authorities.- In 2014/15 there was a definitional change in the data for children's social care which increased this service’s share of spend by around 2 per cent.
- Housing services refers to the general fund revenue account and excludes the Housing Revenue Account.
- Spend funded by NHS transfers to adult social care is excluded as it is not included in the budget data published by DLUHC.
- Council spending on education services has been excluded.
- May not sum to 100 due to rounding.


