This guidance document supports the Greenhouse Gas Accounting Toolkit, which has reporting tabs for capturing Scope 3 emissions. It aims to assist local authorities with understanding the scale of reporting, what to report and how to set an action plan for future reporting.
Introduction
The 2024 LGA Climate Change Survey indicates that 92 per cent of local authorities are reporting on Scope 1 and 2 emissions for their own operations, with a further 35 per cent reporting on some Scope 3 for their own operations.
This guidance document supports the GHG accounting toolkit, which has reporting tabs for capturing Scope 3 emissions. It aims to assist local authorities with understanding the scale of reporting, what to report and how to set an action plan for future reporting. As the understanding and interpretation of the GHG protocol for Scope 3 reporting continues to develop, the GHG accounting toolkit and associated guidance will also be updated. In the summer of 2024 contract level Scope 3 reporting tabs will be added, which will enable councils to account for emissions across separate contracts.
Why should local authorities report on Scope 3
- This will help you to identify and understand the risks and opportunities associated with value chain emissions.
- You will have a clearer picture of overall emissions which will enable you to start to identify GHG reduction opportunities, set reduction targets, and to track performance.
- You will be able to engage value chain partners in GHG management.
- Stakeholder information will be enhanced, together with the authority’s reputation through public reporting.
Who is the guidance for
We recognise that there will be local authorities who will be well versed in this area and reporting on Scope 3 at a more granular level than others, and we welcome your feedback and case studies to build into the ongoing updates that we make to the toolkit and guidance.
- For those local authorities that are at the beginning of Scope 3 reporting, this guidance document will support you through the principles and key themes to consider.
- Carbon/Sustainability Officers, Procurement Officers and Commissioners for service delivery should find this guidance most helpful. When gathering Scope 3 data for reporting, you may need to engage with a wider group of colleagues.
How are Scope 3 emissions defined
The GHG Protocol splits emissions into three distinct reporting scopes, which are described below:
- scope 1 emissions are released as a direct result of an activity. For a local authority this will largely comprise combustible fuel for heating boilers and fuel burned in owned fleet vehicles. There may also be an element of fugitive emissions from air conditioning units and medical gases used in care provision.
- scope 2 emissions are those released as an indirect consumption of an energy commodity. For a local authority this will be the purchased grid electricity used in its operations (buildings, street lighting and for charging Electric Vehicles (EV)).
- scope 3 emissions are all other indirect emissions other than electricity. The measurement of Scope 3 emissions is an emerging area, and they usually represent 70-80 per cent of a local authority’s total emissions.
Scope 3 emissions reporting is relatively new, and methodologies are still emerging to allow for measurement in many areas. It is important to remember that the purpose of reporting is to help develop and support change, it is important therefore to be proportionate and think about how reporting will achieve this for your organisation.
The GHG Protocol Scope 3 Accounting and Reporting Standard states emissions that should be reported as Scope 3 are:
- emissions from activities in the value chain of the entities included in the company’s organisational boundary
- emissions from leased assets, investments, and franchises that are excluded from the company’s organisational boundary but that the company partially or wholly owns or controls.
The GHG Protocol splits Scope 3 emissions into upstream and downstream activities
In the Local Authority context, Scope 3 emissions are those that occur indirectly as a result of the authority’s activity, e.g., emissions that are a consequence of the authority’s operations that occur at sources the authority does not own or control and that are not classed as Scope 2 emissions.
Typically, these relate to the emissions associated with the transmission and distribution of the authority’s purchased electricity, outsourced or contracted operations and business travel by means not owned or controlled by the authority. These will include emissions from water consumption, outsourced fleet vehicles, staff business mileage and major outsourced services such as waste management/treatment, highways maintenance and social care provision.
- scope 3 emissions occur from sources owned or controlled by other entities in the value chain (e.g., materials suppliers, third-party logistics providers, waste management suppliers, travel suppliers, lessees and lessors, franchisees, retailers, employees, and customers). A local authority’s Scope 3 emissions will be another organisation’s Scope 1 and 2 emissions.
- scope 3 emissions are more difficult to account for than Scopes 1 and 2, because the required data often lies with other organisations or individuals. As a result, there is a higher degree of estimation in Scope 3 categories – this is recognised by the GHG Protocol.
Typically, current Scope 3 reporting by local authorities has been limited to staff business mileage, water, and transmission and distribution losses from electricity consumption. More authorities are now looking to report on Scope 3 emissions from staff commuting (including public transport), procured goods and services and outsourced contracts (including construction). In the summer of 2024 contract level Scope 3 reporting tabs will be added, which will enable councils to account for emissions across separate contracts.
Boundary Setting
The GHG Protocol guidance for Scope 3 reporting highlights that there are both opportunities and risks associated with reporting, and target setting. These are explored here in the Local Authority context:
Risks
Opportunities
Prioritisation
In addressing Scope 3 emissions and deciding what to include in future reporting, local authorities need to prioritise activities where data collection and reporting will lead to a meaningful impact.
The mapping/screening activity is required to understand the scale of the emissions that could be reported as Scope 3. To identify all possible emissions sources for each of the reporting categories, it is often referred to as casting a “wide but shallow net”. This approach will identify the vast majority of material sources of emissions from service provision in house, and services commissioned by the authority, and then undertake a prioritisation activity to focus in on those emission sources where meaningful data can be reported, and where there is opportunity to manage and reduce emissions.
The following outlines the recommended steps for this exercise.
Exercise to identify and prioritise scope 3 emissions for reporting
Step 1: Identify the Scope 3 emissions sources
A first step towards reporting on Scope 3 emissions will be to understand what the emissions sources are, whether the data is available and the degree of accuracy of the available data before embarking on producing a Scope 3 baseline. This will involve an emissions mapping exercise, and the production of a plan to develop the reporting for this service area – it is unlikely that all the data for the reporting activities outlined in this guidance will be available at the outset for most local authorities.
- Create a “long list” of potential emissions sources – this can begin with engaging with colleagues across service areas to identify contracts and procurement of goods and supplies, and then cross referenced against a category analysis (usually undertaken by procurement officers).
- To the extent possible, local authorities should create a complete value chain map and/or a complete list of activities in their value chain that includes:
- a list of purchased goods and services and a list of sold goods and services; and
- a list of suppliers and other relevant value chain partners (either by name, type, or spend category).
Local authorities should be striving for completeness in this long listing activity, but it is acknowledged that achieving 100 per cent completeness may not be feasible. Producing a representative list of Scope 3 emissions sources at this stage is acceptable.
Outputs
From this activity, you may be able to calculate indicative emissions using the spend based analysis. High areas of spend on goods, materials and outsourced contracts will point to priority areas for reporting and emissions reduction.
Step 2: Review the list from a “Control vs Influence” lens
Using the long list of emissions sources, work with colleagues to explore what role the council has in relation to control and influence. Compared to Scope 1 and 2 emissions, the level of control over Scope 3 emissions will always be somewhat limited. Where we are talking about control for Scope 3, we are really thinking about where there are opportunities to ensure that there is data provision (for example by inclusion of these requirements in the contracts for commissioned services) and scope for enabling and driving emissions reductions. Where there are choices between low carbon goods and less sustainable options for purchasing of goods and equipment, there is also a higher degree of control here.
Influence, in the context of a local authority’s scope 3 emissions, will be in relation to emissions from staff commuting for example – there will be opportunities for a local authority to offer incentives to encourage employees to switch their mode of transport away from individual cars, but ultimately the authority cannot make that decision on behalf of each employee – they can encourage behaviour change and emissions reduction.
Sorting the long list of emission sources into these two categories will assist with the next stage, which is to work through the list against the GHG Protocol principles
Step 3: Develop a shortlist of relevant emissions for inclusion
Using the principles in mentioned in section 2, work through your sorted list to develop a shortlist of relevant emissions for inclusion with a Scope 3 reporting boundary for local authority operations.
Local authorities should determine which sources of emissions are relevant to their own operations. Scope 3 emissions might be relevant if:
- the level of the emissions is large compared to the Scope 1 and 2 emissions;
- they contribute to the authority’s financial or regulatory risk exposure;
- they are important to the authority’s stakeholders, e.g. members, local campaign group, etc.
- perhaps most importantly if they offer the opportunity for big reductions in emissions.
An example of emissions sources that may be considered important to be reported against each are:
We talk about a wide but shallow view to setting a boundary for reporting – look at what is important/relevant to the individual authority. Consider the size of the emission source, and the ability of the authority to control it or have influence over it. Producing a long list of all possible sources to report, then narrowing this down to the relevant emissions for the individual authority is recommended.
By the end of this stage, you should have a list of Scope 3 emissions sources for inclusion within your reporting boundary for the council’s own operations.
Step 4: Review the shortlist for data availability and accuracy
The shortlist of relevant emissions sources for the Scope 3 boundary needs to be reviewed for data availability and accuracy.
Availability and accuracy of data for Scope 3 emissions is a widely acknowledged issue, and the key challenge with reporting, setting a baseline year and targets for reduction.
Scope 3 emissions reporting for outsourced services is not as well established, and it may take some time to establish a reporting boundary and identification of activities on which to report. A base year for scope 3 emissions should be set, this may not be the first year of reporting, it may be more appropriate to set a base year to align with a specific point in the commissioning cycle, for example, which may be in the future. For example, reporting can be undertaken prior to this, to establish emission’s sources and the data collection requirements.
The base year can be set for when the Scope 3 inventory is sufficiently complete and reliable, for example at the point of commissioning a new major contract. Data collection and reporting can begin prior to this (for information) with the baseline year for setting a reduction target set against for when the data is of appropriate quality and robustness to begin measuring progress against.
Setting a base year for Scope 3 emissions may be a more recent point in time than an authority will have set for their Scope 1 and 2 emissions, as local authorities may have been reporting on these emissions for a number of years, data is readily available and reporting methodologies are well established.
Local authorities should determine whether it is possible to calculate or estimate emissions for each of the sources that have been identified. It is recognised and accepted that Scope 3 data might be less accurate than other data, because of the availability and/or reliability of the necessary information. It is acceptable to estimate the Scope 3 emissions, provided that the methods used to make the estimations are transparently reported.
Scope 3 emissions reporting categories
The following sections will provide additional guidance about emission’s sources currently captured in the GHG Accounting Toolkit.
Procured goods
The GHG Accounting Toolkit has a range of reporting categories for procured goods and materials (aligned with the BEIS emissions factors)– this is not an exhaustive list, but at this stage, is a good starting point and comprises:
- food and drink
- electrical items - IT*
- plastics: average plastics
- plastics: PS (incl. forming)
- plastics: PVC (incl. forming)
- paper and board: paper.
It is suggested that category analysis for the procurement of goods is undertaken, to identify areas of high spend (as opposed to the procurement of commissioned/outsourced services). These may correspond with the above categories, or there may be additional line items. If this is the case, to support future development of this reporting function in the toolkit please contact [email protected].
An important consideration when analysing goods procurement and making the decision to report within a Scope 3 boundary, is the impact of the purchasing decision including looking at:
- single use products
- whether more sustainable options are available – e.g., different material, low carbon deliver
- volumes
- closed loop – options for refilling, reusing or recycling/return of goods to supplier/manufacturer.
How to calculate
Until 2011, an annual dataset was published by Defra, with a methodology for applying a carbon emissions factor to a £ value, to estimate the emissions associated with the spend against that service or goods.
This dataset has been discontinued, and organisations are encouraged to use the BEIS emissions factors in the annually published conversion factors dataset which is the source data the GHG Accounting Toolkit uses in the Scope 3 tabs.
The challenge for local authorities will be applying a methodology to convert spend data to tonnage data, if the volumes are not available. Reporting within the tool is in the Scope 3 tab within the table beginning at cell B97.
Homeworking
Many local authorities have adopted a flexible or agile working approach for a number of years, more recently the COVID-19 pandemic with national lockdowns and work from home orders has meant that working from home has become the new normal for a large proportion of local authority workers
This looks like it will be here to stay, with many local authorities adopting a hybrid working policy. This has implications for GHG reporting, on several fronts.
Under the GHG protocol, homeworking is currently an optional disclosure covered in the Employee Commuting (Category 7) section. Although the GHG protocol notes where to disclose these emissions, it does not provide a methodology for this quantification. Historically, homeworking emissions have tended not to be accounted for in this manner due to difficulties in sourcing data on which to base emissions calculations and a previously justifiable assumption that this would not be as material as other elements. This is not the case anymore.
Durham/LGA case study
Using over forty volunteers from the staff of Durham University and Durham County Council, data on home energy usage was collected from the year before lockdown (March 2019 to February 2020) and the year after (March 2020 to February 2021). This was combined with energy consumption data over the same period for the seven buildings in which the volunteers worked. A survey was undertaken with the volunteers, collecting travel data on their commuting practices prior to and during COVID-19 and background information on their home energy usage. The data analysis in this particular case study showed that the carbon emissions related to travel far outweighed the building related impacts of lockdown. Staff who travelled long distances by car before the pandemic made major carbon reductions from home working, even if they increased their home energy consumption, whereas staff who walked or cycled to work generally increased their carbon emissions by home working. The parties did not undertake any analysis of journeys made by public transport. The parties also found that many of the main offices showed only small reductions in energy consumption and carbon emissions after the initial and most intense lockdown period. Without careful zoning and other efficiency measures, the use of heating, lighting, etc. tends to be largely unchanged when a reduced number of staff are in the building.
A freely available, open access White Paper produced by the consultancy Ecoact suggested a methodology for accounting for homeworking emissions – which was supported by Bulb.
Following a review of available methodologies recently published, it is suggested that this methodology is robust for calculating estimated emissions for home working. We recommend that the methodology is followed to calculate the energy consumption for electricity and gas in kWh, and then this data reported in the Scope 3 tab of the GHG Accounting Toolkit.
Reporting within the tool is in the Scope 3 tab within the table beginning at cell B59.
Employee Commuting
Emissions from vehicles used for staff commuting to and from work is an area that local authorities can account for. The GHG Accounting Tool contains tables in which the distance travelled in various vehicle types can be recorded. Local authority employees can be asked annually to provide information on the types of vehicles that they use and the distance that they travel. In order to encourage full participation in such data collection exercises, employees could be given incentives to provide the information, e.g., vouchers, reductions in the staff canteen etc. Alternatively, it could be made a condition of employment that the data is provided.
Another factor in encouraging good participation is ease of use. If the local authority provides staff with a user-friendly web-based platform, this would be more likely to produce good data, rather than a complicated spreadsheet or pages and pages of hard copy documents to complete. Clearly articulated questions will also significantly improve the completeness and accuracy of the employee commuting activity data.
By accounting for employee commuting, local authorities might find that several practical opportunities arise for reducing emissions. If there is a large amount of car use highlighted, incentives could be given for choosing public transport, or a cycle-to-work scheme could be implemented. If the local authority is considering moving offices, the data on commuting could assist in deciding on new locations, for example nearer to where a number of staff live, or nearer to public transport, or to an office with better bicycle storage facilities/showers/etc.
As noted in the homeworking section above, with the move to hybrid working, emissions from homeworking will have gone up while emissions from employee commuting will have gone down. Accounting for both areas will give the local authority a better picture of the emissions involved in trying to achieve a good balance between home working and returning to the office.
Further details on options for accounting in relation to employee commuting can be found in Category 7 of the GHG Protocol: Technical Guidance for Calculating Scope 3 Emissions. Reporting within the tool is in the Scope 3 tab within the table beginning at cell B34.
Outsourced services
The mapping exercise will have most likely indicated the highest areas of spend and therefore emissions. High value, large, outsourced contracts are likely to present the biggest opportunity for making emissions reductions.
The types of contracts that are likely to be at the top of the emissions source list will include (but not limited to):
- waste management services (collection, disposal, treatment)
- facilities management
- leisure centres
- highway maintenance
- social care and children’s services (including home to school transport).
There is a greater opportunity for accessing good quality data for reporting on emissions arising from delivery of services. Typical data sources will include (but not limited to):
- vehicle mileage (refuse collection vehicles, maintenance vehicles, community transport)
- energy consumption data (depots, leisure centres, waste treatment plants, care homes)
- Staff business mileage
Opportunities for setting data provision requirements will be at the point of commissioning services and the development of contract specifications. Inclusion of requirements to provide good quality, relevant data, and setting targets for emissions reductions throughout a contract term should be considered for each and every commissioning exercise.
In relation to setting an appropriate baseline year for Scope 3 reporting, it is suggested that reviewing the commissioning cycle for the major outsourced contracts and commissioned services to identify opportune points for inclusion of reporting and emissions reductions in new contracts, or at appropriate review points (extensions, contract review periods).
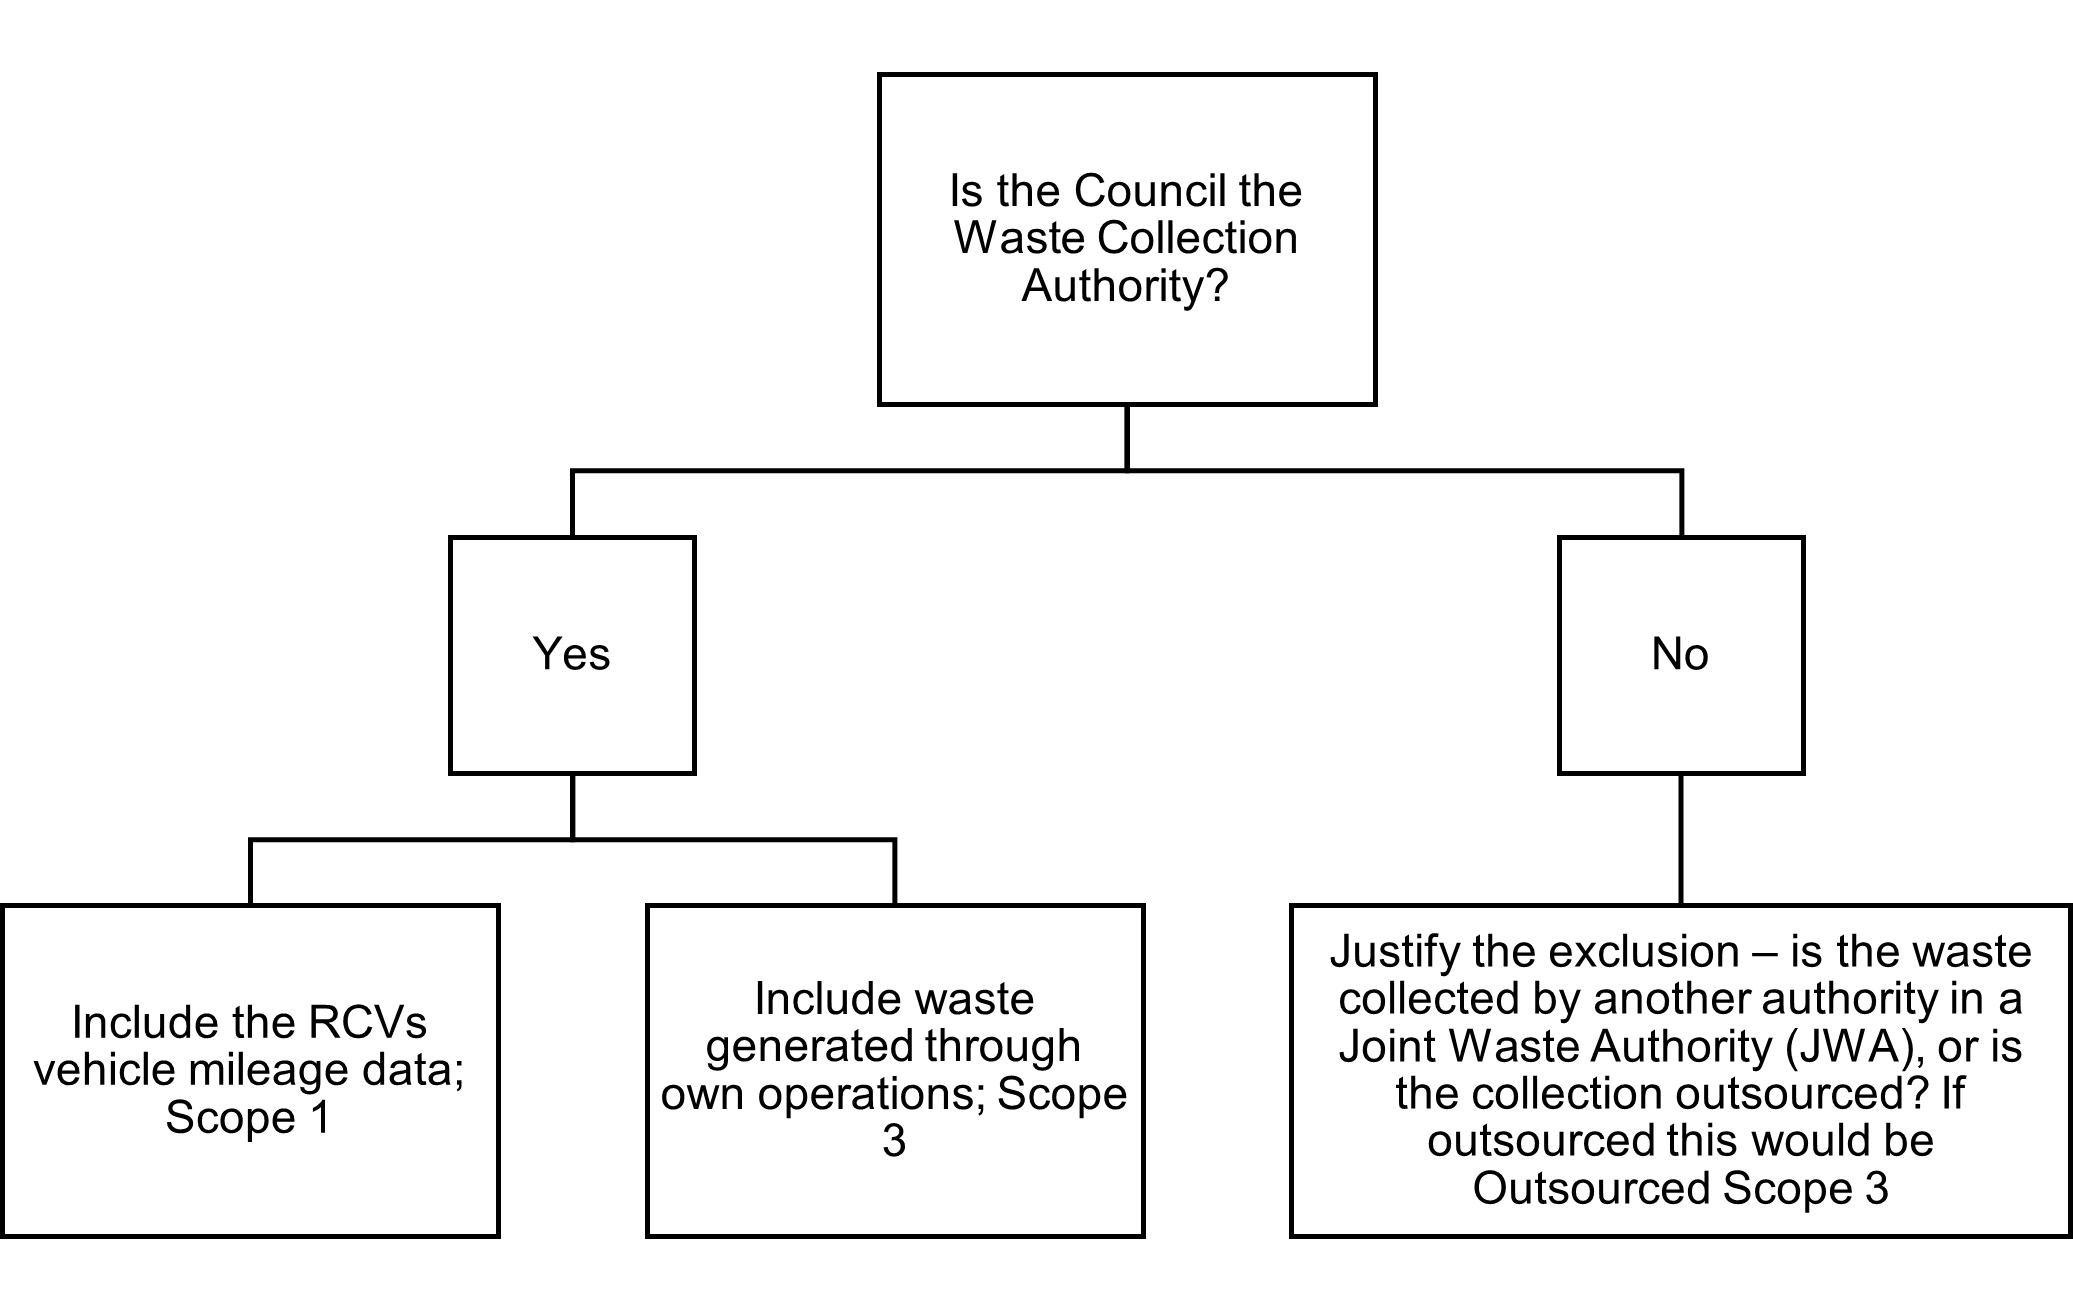
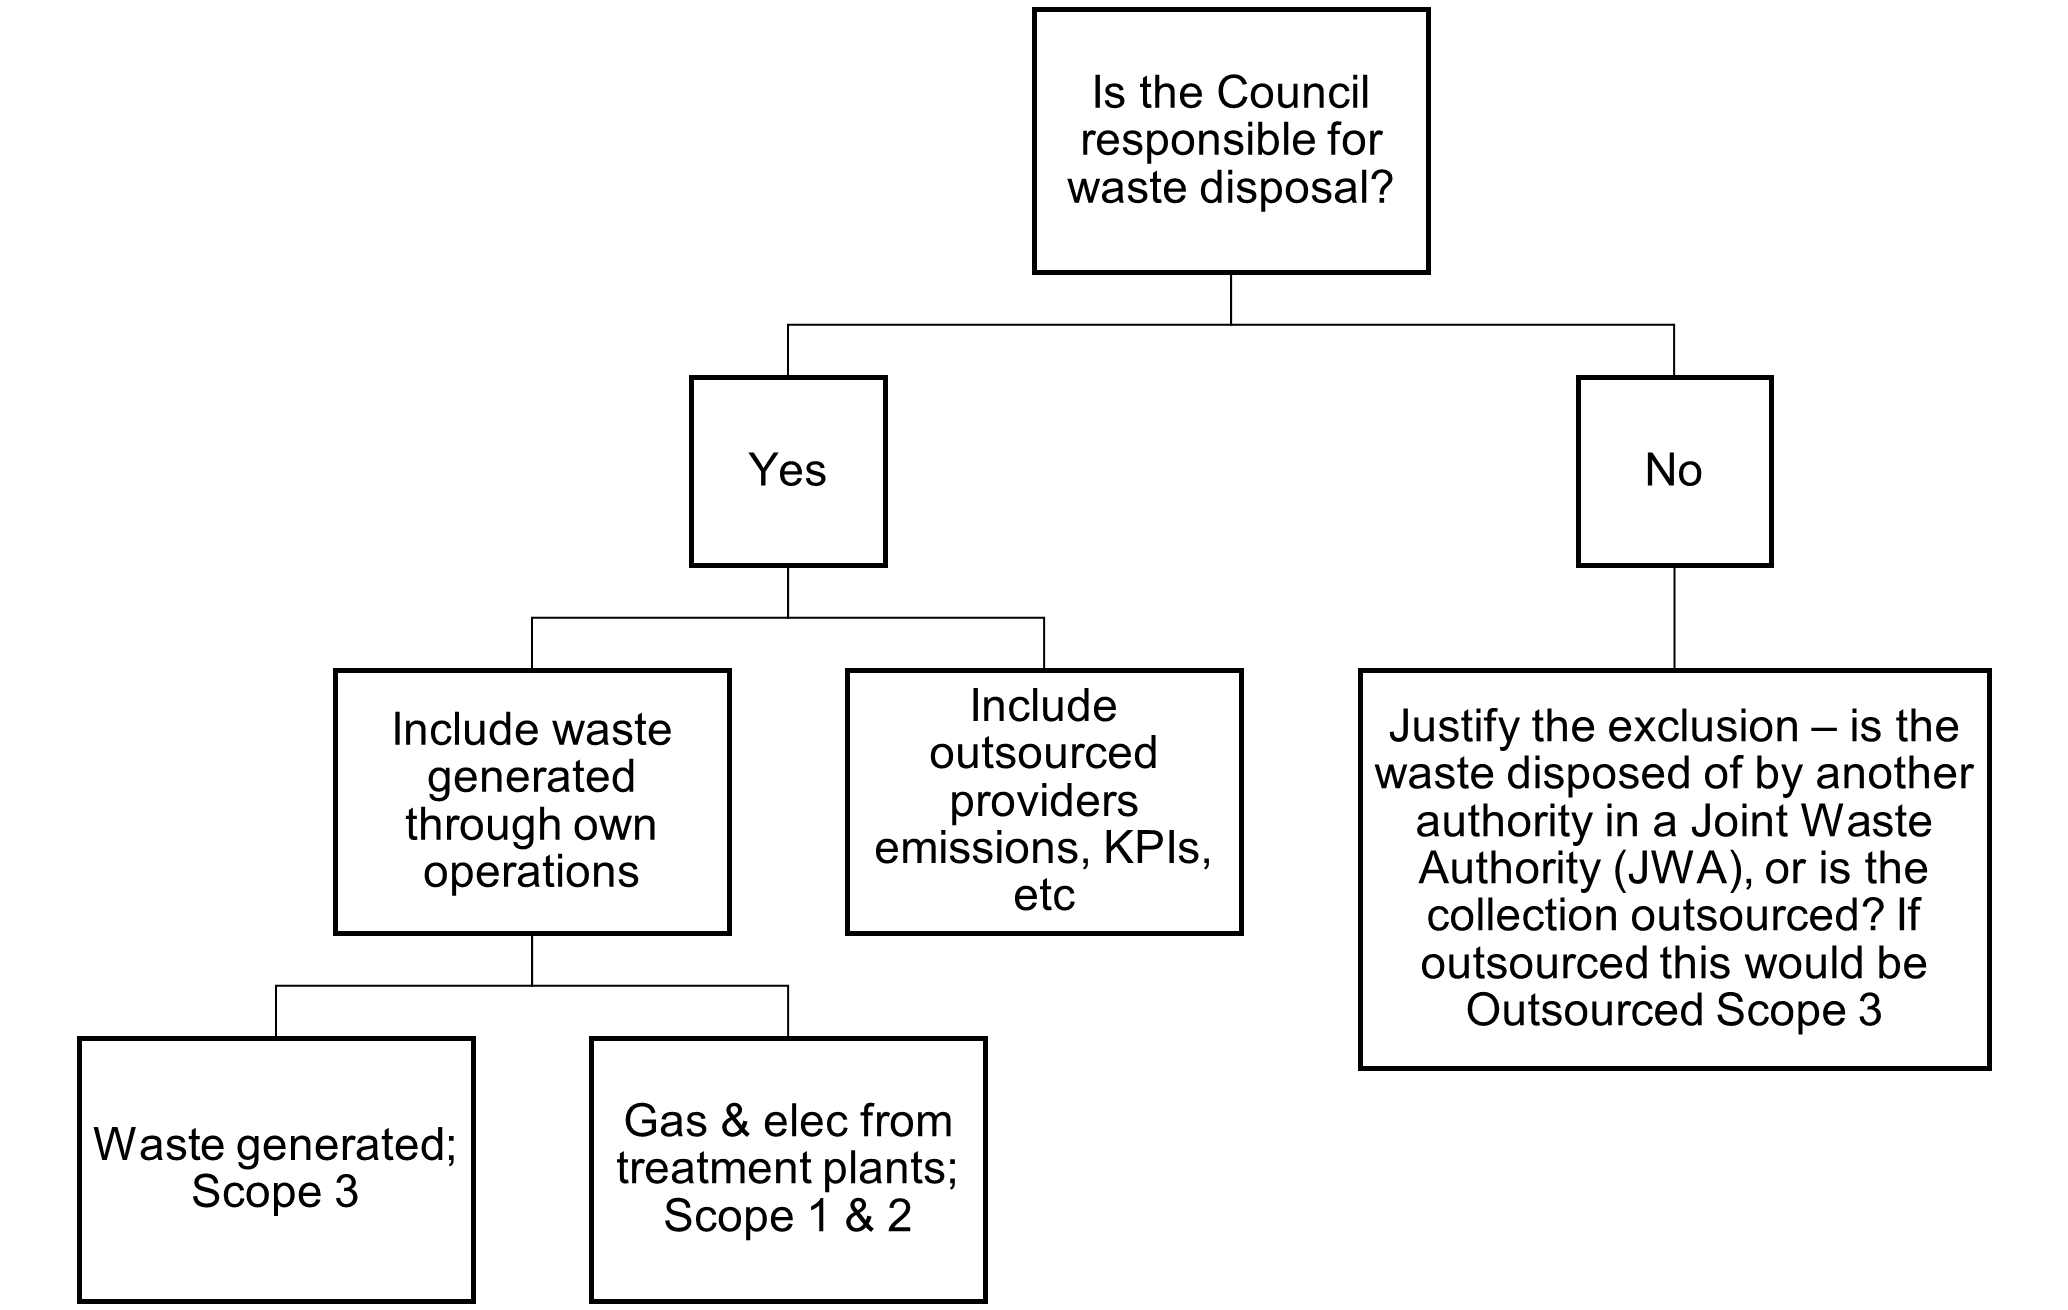
Focus on waste
Scope 3 emissions in the waste sector are those created during the disposal and treatment of waste generated in the local authority’s area in the reporting year (in facilities not owned or controlled by the local authority). The minimum reporting boundary would be the Scope 1 and Scope 2 emissions of waste management suppliers that occur during disposal or treatment. The optional element would be the emissions from the transportation of waste.
Waste treatment activities may include:
- disposal in a landfill
- disposal in a landfill with landfill-gas-to-energy (LFGTE) – i.e., combustion of landfill gas to generate electricity
- recovery for recycling
- incineration
- composting
- waste-to-energy (WTE) or energy-from-waste (EfW) – i.e., combustion of municipal solid waste (MSW) to generate electricity
- wastewater treatment.
Examples of primary data include site-specific emissions data from waste management companies, company-specific metric tons of waste generated, and company-specific emission factors. Examples of secondary data include estimated metric tons of waste generated based on industry average data, and industry average emission factors.
There is a carbon assessment tool specific to the waste sector that is available for local authorities called WRATE. This was originally developed by the Environment Agency but is now managed by a company called Golder Associates (UK) Ltd, which charges local authorities a fee for a licence to use the tool. Regarding the appropriate emission factors to use, Defra recommends the factors that are produced by WRAP.
We are aware that an increasing number of local authority trading companies are being used by authorities to collect waste. Local authorities will need to carefully consider which party is going to account for the emissions, and will need to have regular dialogue with the companies that they are invested in to avoid double counting.
Examples of actions that local authorities can take to reduce emissions in the waste sector include:
- reducing the quantity of waste generated in operations
- implementing recycling measures that lead to net GHG reductions
- implementing lower-emitting waste treatment methods.
Reporting within the tool is in the Scope 3 tab, within the table beginning at cell B109.
Social care
Social care provision will be a mix of contract and service types, adding complexity to the reporting landscape, the practicalities of data collection, and the ability for the reporting authority to make a meaningful impact in reducing greenhouse gas emissions.
Please refer to the Scope 3 Greenhouse Gas Emissions Reporting for Social Care for further guidance.
Social housing
The housing stock that a local authority owns and manages could be a significant source of GHG emissions. The local authority will not always have control over the sources of the emissions, so it will need to consider carefully what it can account for. There are likely to be certain areas that the local authority has control over, and other tenanted areas where it has limited ability to manage the emissions. The local authority as landlord will be responsible for both the selection of the boiler/fuel and the standard of insulation. Whilst it cannot control the thermostat settings of how electricity is used it does have some control over a significant area of emissions. We anticipate development in this area in future years.
The local authority is likely to be responsible for communal areas of the housing such as external lighting, entryways, corridors, stairways, etc. Therefore, it would have control over the emissions from the lighting, heating, etc. in these areas. As the local authority could influence the emissions by, for example installing more energy efficient lighting or replacing gas central heating with a heat pump, it would make sense for the local authority to account for these emissions. Reporting for these areas would be under Scopes 1 and 2, and this is noted in the first tab of the GHG Accounting Toolkit.
Some local authorities will have contracts with providers to supply gas and electricity to the tenanted area of housing stock, and then the local authorities will charge the tenants. If part of the housing is funded by a local authority Housing Revenue Account, the local authority could account for that aspect, because it is within their financial control. In this situation the local authority would have more control than if the tenants contract directly with providers, because they could for example choose green tariffs or select providers that provide more information about the sources of the energy being provided.
A good starting point when considering housing is to ensure that the local authority has accurate data over which areas of properties it has responsibility for gas/electricity, etc. As a general rule, we suggest if the local authority is the landlord but is not responsible for the bills in a certain area, then the local authority does not account for these emissions. If a tenant has control over the bills for their area it would make more sense for them to account for those emissions.
However, it is possible that tenants would not account for the emissions from their area. If the local authority wishes to account for emissions across the housing stock including tenanted areas, then certain assumptions about energy usage would need to be made. The EPC certificates for the properties would be a good starting point for making these assumptions. This data would not be reportable via the GHG Accounting Toolkit.
Case study: Dacorum Borough Council
Dacorum Borough Council have used the BEIS housing emissions data (CO2) and proportioned this out by the total number of council owned homes/total number of homes in the borough. They have then factored in the council average EPC/national average EPC ratings. Finally, they have uplifted the CO2 figure to account for other GHG’s (converted to CO2e), so that it is comparable to the other emission sources reported in terms of CO2e. Dacorum’s net zero target for 2030 is for scopes 1-2 within their organisation only. As housing emissions are classified as scope 3, Dacorum will not be including these in their organisational footprint. However, as part of their climate emergency commitment and strategy, they have a target for their housing stock to reach net zero by 2050, which is why they will be measuring and reporting on these emissions separately.
We would be interested to hear from other local authorities regarding the approach that they are taking in this area. Local authorities should be aware of the SCATTER tool. This is an emissions tool which provides local authorities and city regions with the opportunity to standardise their GHG reporting and align to international frameworks, including the setting of targets in line with the Paris Climate Agreement. It is free to use for all local authorities in the UK. The SCATTER tool is area-wide, so would cover non-local authority areas/properties. If a local authority is not responsible for emissions because of per capita dwelling, then the SCATTER tool will be relevant.
Leased Assets and Investments
Following the austerity drive by central government in the years 2010-2016 and the associated reduction in local authority funding, there was pressure on local authorities to carry out their tasks more efficiently with fewer resources. Historically low interest rates gave local authorities the ability to borrow large amounts of money to make commercial investments with the possibility of making large returns. Also, the local authority general power of competence introduced by the Localism Act 2011 offered opportunities for local authorities to generate income in innovative ways.
This means that many local authorities will have made investments in areas where they do not have control over the emissions, e.g., retail parks, business parks, office accommodation leased to businesses, etc. They might have created joint-venture companies with private sector parties, made investments in start-up companies, etc. The public sector’s initial enthusiasm for commercialisation has reduced in recent years.
However, many local authorities will still have responsibilities in relation to leased assets and investments, and the GHG emissions from these are likely to be a significant proportion of their overall emissions. There has been a focus in recent years on the investments made by local authority pension schemes, with many councils seeking to decarbonise their investments by divesting from fossil fuel companies. There has also been a huge rush recently to divest from Russian companies following the war in Ukraine.
Leased assets may be included in a local authority’s Scope 1 or Scope 2 inventory depending on the type of lease and the consolidation approach the local authority uses to define its organisational boundaries (the financial/operational control approach or the equity share approach).
The first step in determining how to categorise emissions from leased assets is to understand the two different types of leases: finance/capital leases, and operating leases. One way to determine the type of lease is to check the local authority’s audited financial statements.
- Finance or capital lease: This type of lease enables the lessee to operate an asset and also gives the lessee all the risks and rewards of owning the asset. Assets leased under a capital or finance lease are considered wholly owned assets in financial accounting and are recorded as such on the balance sheet
- Operating lease: This type of lease enables the lessee to operate an asset, like a building or vehicle, but does not give the lessee any of the risks or rewards of owning the asset. Any lease that is not a finance or capital lease is an operating lease
- Upstream leased assets: This category of leased assets refers to the operation of assets in which the local authority is the lessee/tenant, renting a property from another party. This could include vehicles that the local authority hires from a company, e.g., vans, RCVs. The Scope 3 emissions to account for here would be those that occur during the local authority’s operation of the leased assets (e.g., from energy usage). Optional reporting would include the life cycle emissions associated with manufacturing or constructing the leased assets. If the local authority leases an asset for only part of the reporting year, it should account for emissions for the portion of the year that the asset was leased. The owner/landlord of the property could account for the Scope 1 and 2 emissions, while the local authority could account for the Scope 3. This is an example of when different parties would account for the same emissions in Scopes 1 or 2 and Scope 3.
- Downstream leased assets: This category refers to the operation of assets owned by the local authority, i.e. they are the lessor/landlord and renting to another party. The Scope 3 emissions to account for here would be those that occur during the tenant’s operation of the leased assets. Again, optional reporting would include the life cycle emissions associated with manufacturing or constructing leased assets. The local authority as owner/landlord could account for the Scope 1 and 2 emissions, while the third-party tenant could account for the Scope 3.
Scope 3 reporting in the Greenhouse Gas Accounting Toolkit
The GHG Accounting Toolkit has two tabs for accounting for Scope 3 emissions, the first being “Scope 3” and the second being “Outsourced Scope 3”. The Scope 3 tab is for data related to staff travel, homeworking, electricity transmission and distribution losses, water usage, the procurement and use of materials, and waste generated from local authority operations.
The Outsourced Scope 3 tab is for emissions that come from activities provided to the local authority by other parties, including heating, fugitive emissions from refrigerants/air conditioning units, etc., vehicles, electricity usage in buildings, provider staff travel, usage of materials by providers, waste generate by outsourced operations, etc.
In the summer of 2024 contract level Scope 3 reporting tabs will be added, which will enable councils to account for emissions across separate contracts.
There is a box in which you can add comments or clarifications at the bottom of each tab. If you have any questions regarding the use of the two tabs, please refer to the FAQ or contact us at [email protected].