Introduction
The LGA highlights that there is an underlying tension between national ambitions for high standards of environment protection and rapid housing growth.
Environmental law designed to protect fragile natural habitats has stopped all planning decisions on new development in certain river catchment areas, having a range of impacts on councils’ ambitions for places and communities. It is also a challenge to local plan led development.
The purpose of this research is to investigate the potential impact of these advice areas on new housing delivery to provide some evidence for the total number of new homes that could be affected.
The research is wholly backwards looking and past performance is not necessarily reflective of what will happen in the future, and it does not factor for instances where mitigation measures have enabled some development to take place. Therefore this analysis should be supplemented by further research investigating the location of future housing supply relative to the advice areas.
Methodology
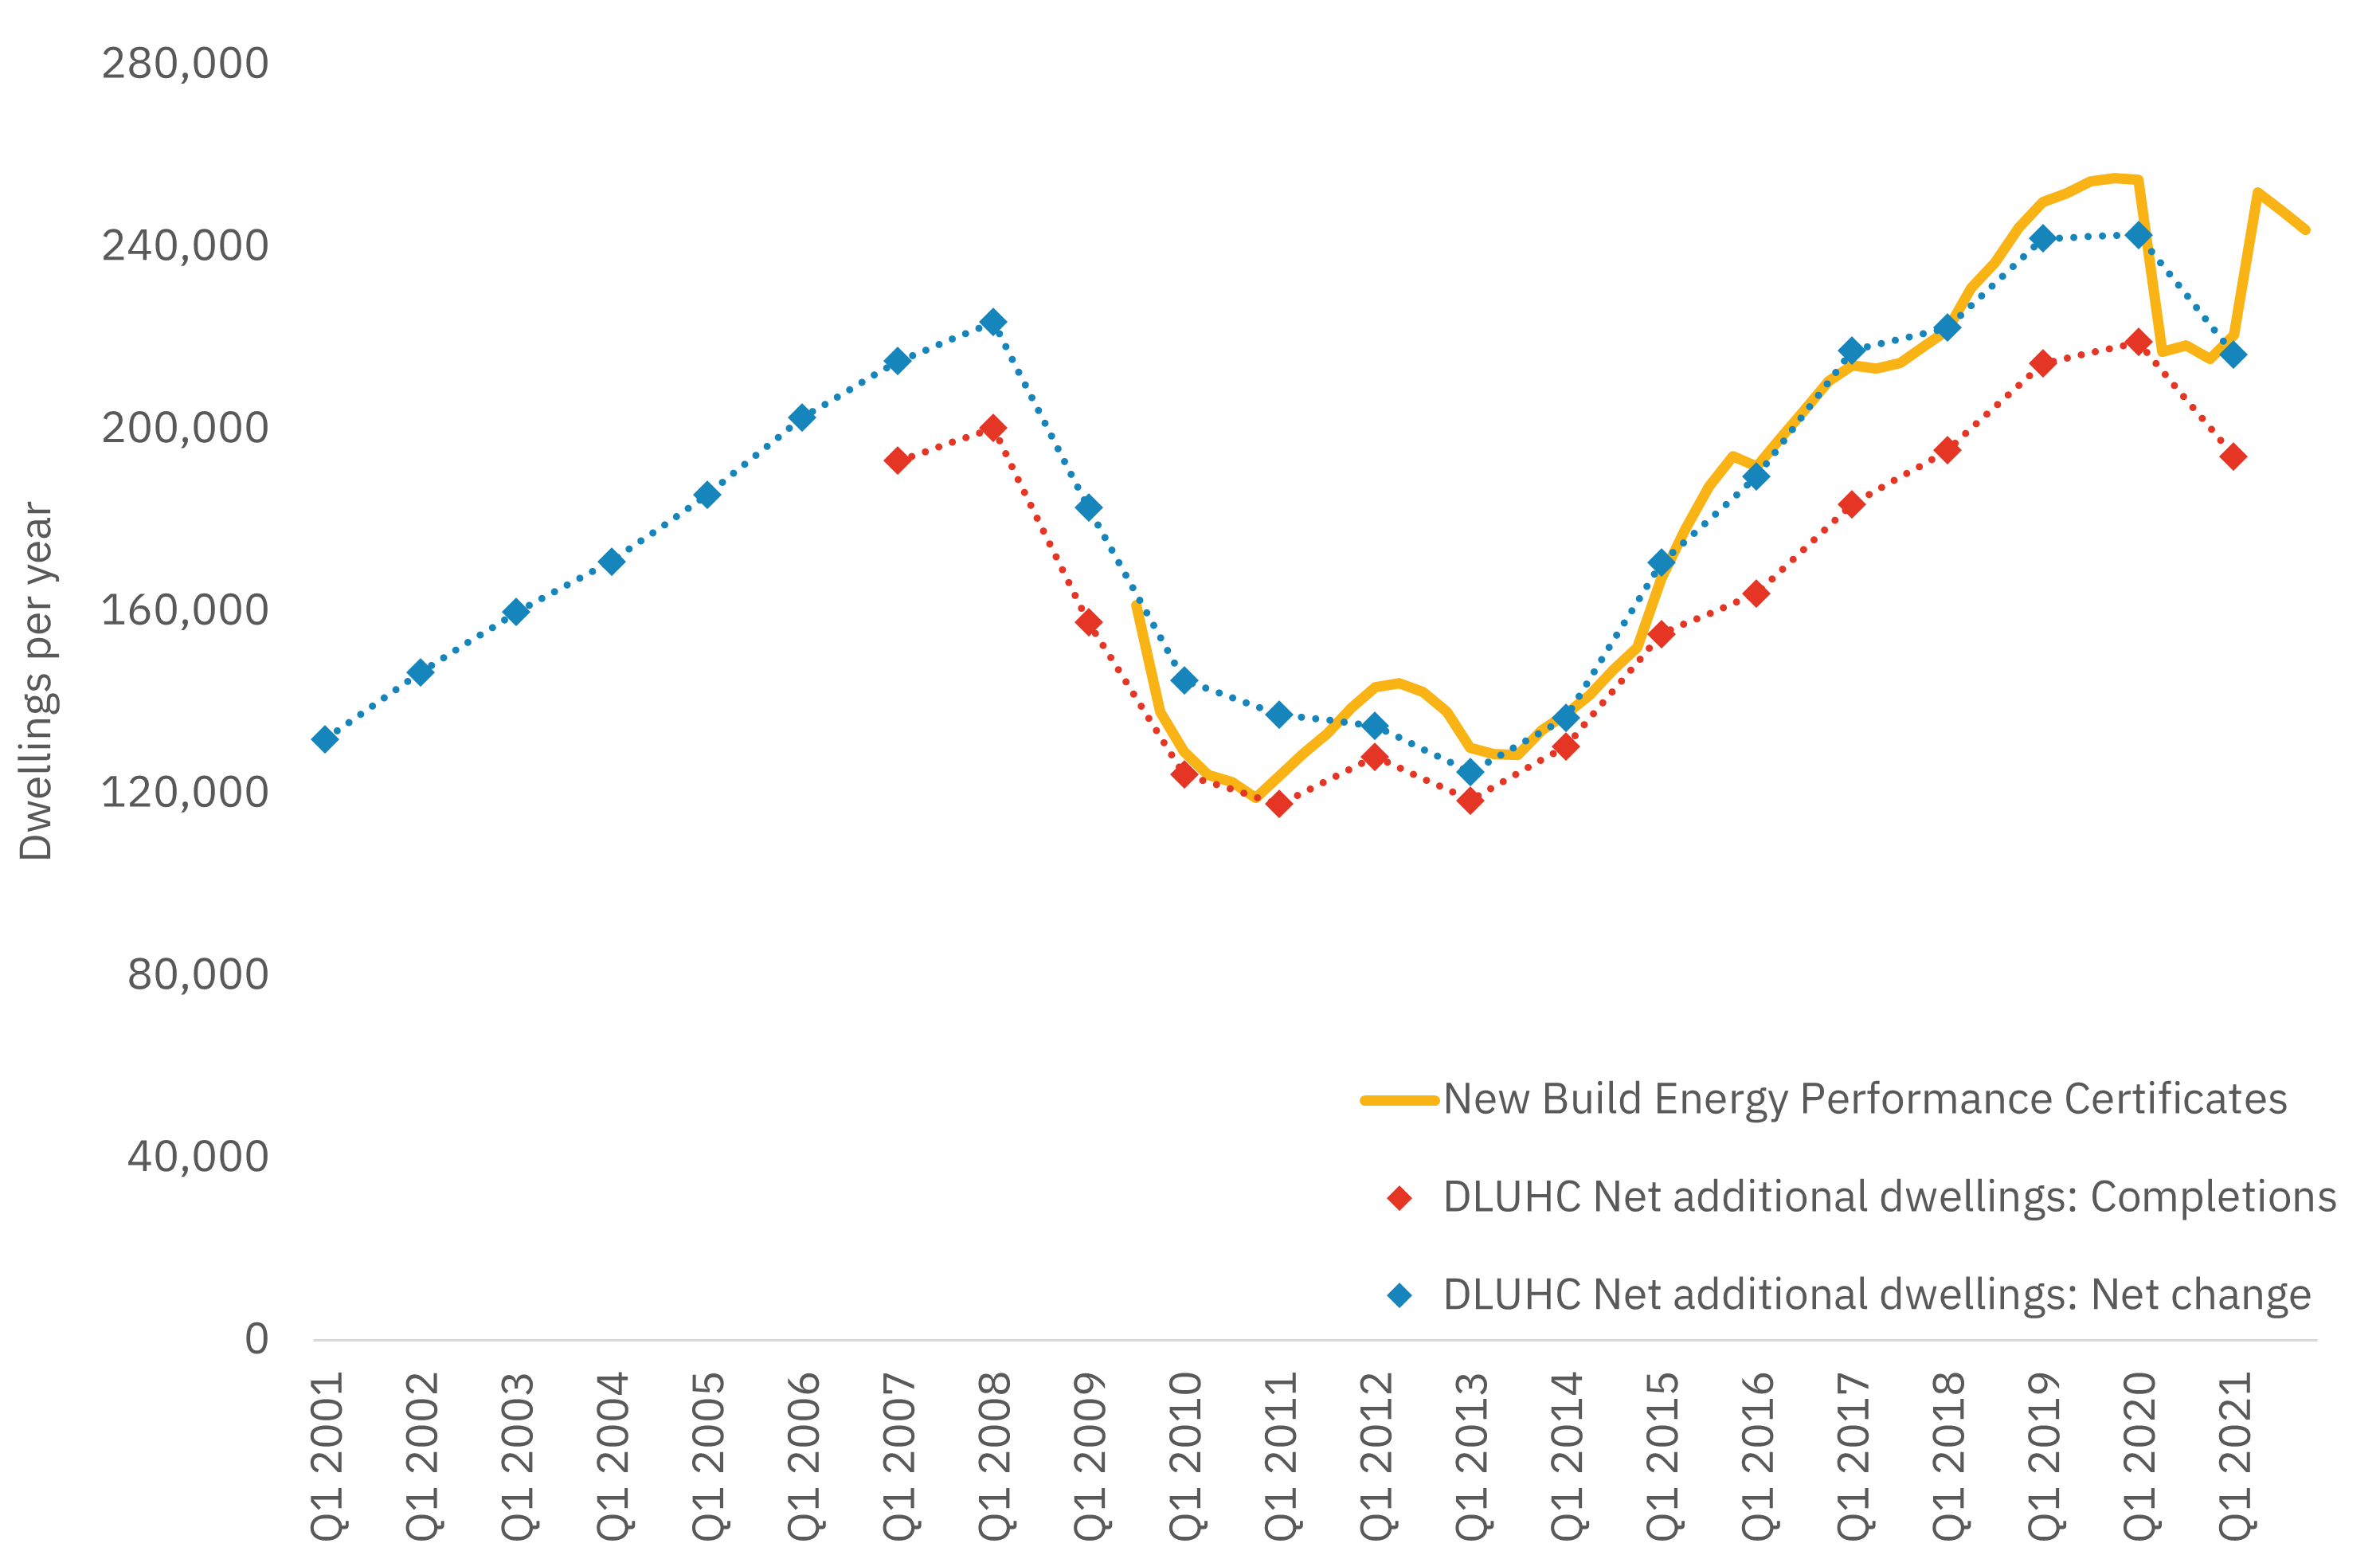
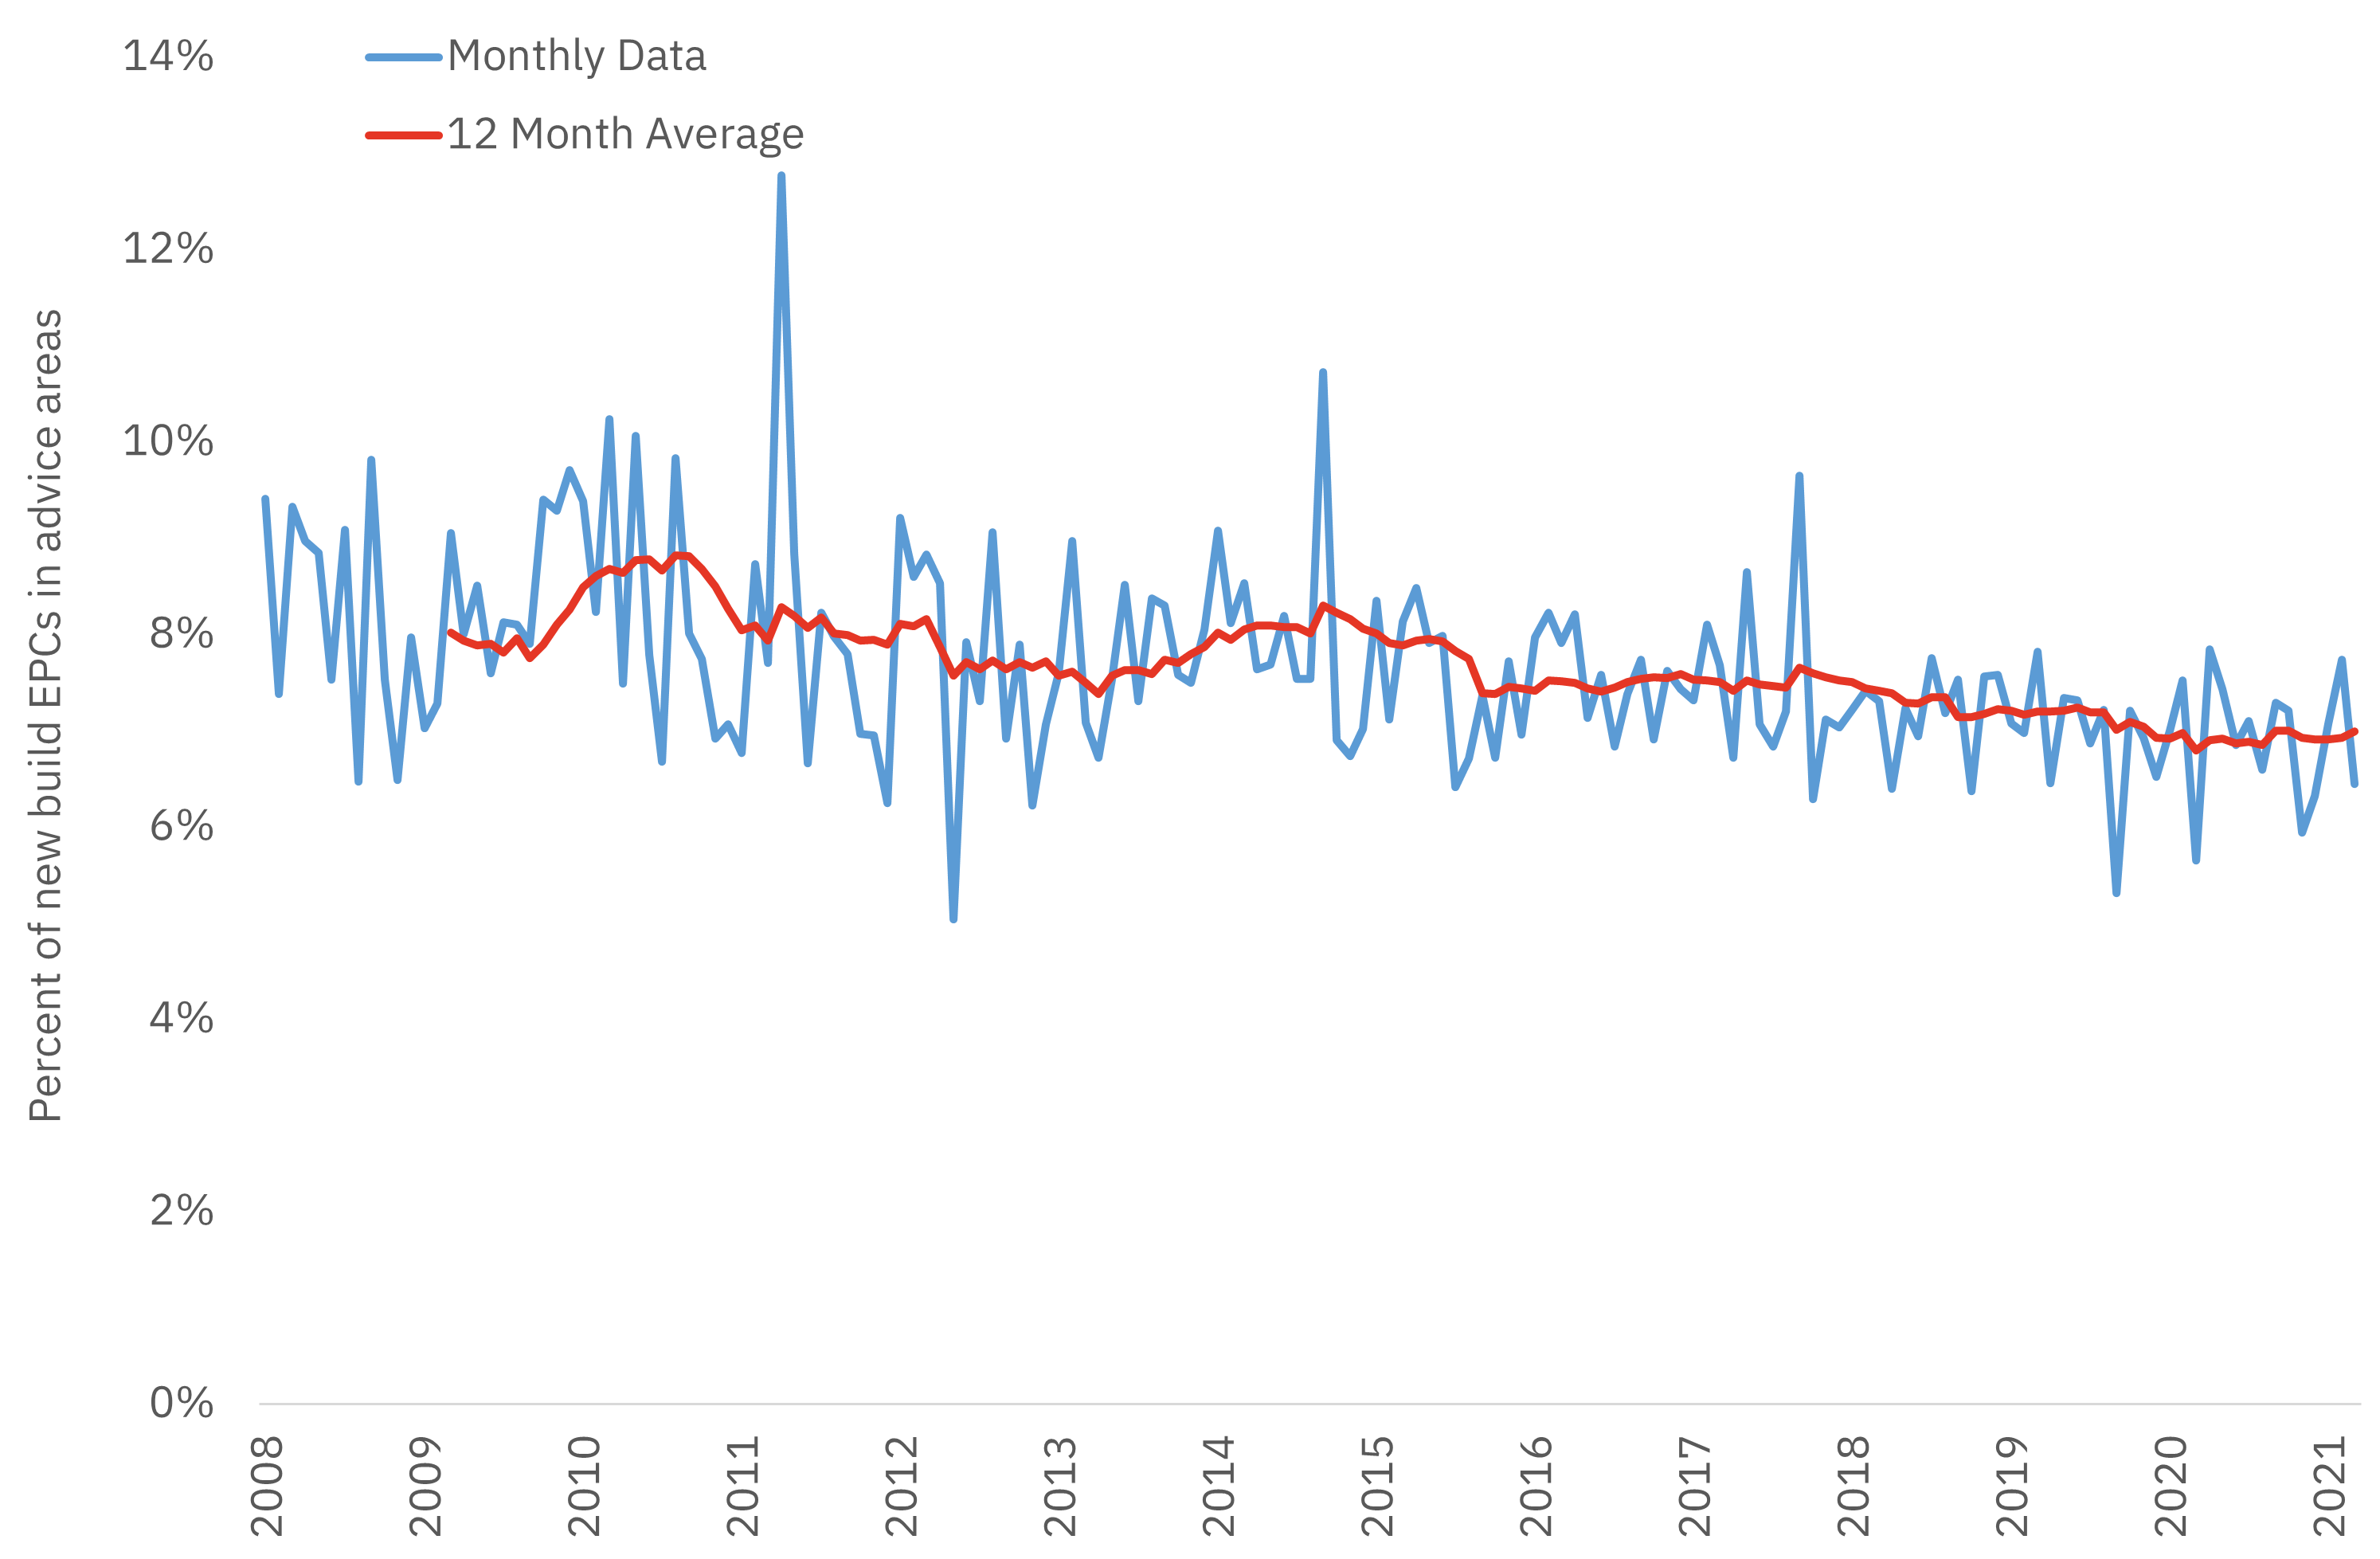
The number of Energy Performance Certificates (EPCs) on new build properties have proved a useful leading indicator for net additional supply in recent years.
The chart (fig 1) below highlights the relationship between EPCs and net additional supply across England with this relationship also holding at local authority level – for example, see our Housing Supply by LA charts on BuiltPlace.
DLUHC now release EPC records for individual properties and so we can use this data to investigate trends in bespoke areas rather than just by local authority.
| Date | DLUHC Indicators of new supply: Completions | New Build Energy Performance Certificates | DLUHC Net additional dwellings: Completions | DLUHC Net additional dwellings: Net change |
|---|---|---|---|---|
| Q1 2001 | 133,250 | 132,000 | ||
| Q2 2001 | 129,880 | |||
| Q3 2001 | 129,920 | |||
| Q4 2001 | 129,500 | |||
| Q1 2002 | 129,860 | 146,700 | ||
| Q2 2002 | 132,520 | |||
| Q3 2002 | 132,950 | |||
| Q4 2002 | 136,800 | |||
| Q1 2003 | 137,740 | 159,870 | ||
| Q2 2003 | 139,130 | |||
| Q3 2003 | 140,550 | |||
| Q4 2003 | 144,060 | |||
| Q1 2004 | 143,960 | 170,970 | ||
| Q2 2004 | 147,870 | |||
| Q3 2004 | 153,610 | |||
| Q4 2004 | 154,070 | |||
| Q1 2005 | 155,890 | 185,550 | ||
| Q2 2005 | 157,450 | |||
| Q3 2005 | 155,470 | |||
| Q4 2005 | 159,450 | |||
| Q1 2006 | 163,400 | 202,650 | ||
| Q2 2006 | 165,730 | |||
| Q3 2006 | 165,470 | |||
| Q4 2006 | 160,860 | |||
| Q1 2007 | 167,680 | 193,080 | 214,940 | |
| Q2 2007 | 168,120 | |||
| Q3 2007 | 169,810 | |||
| Q4 2007 | 176,640 | |||
| Q1 2008 | 170,610 | 200,300 | 223,530 | |
| Q2 2008 | 165,520 | |||
| Q3 2008 | 159,400 | |||
| Q4 2008 | 148,010 | |||
| Q1 2009 | 140,990 | 157,630 | 182,770 | |
| Q2 2009 | 134,120 | |||
| Q3 2009 | 130,210 | 161,452 | ||
| Q4 2009 | 124,980 | 138,052 | ||
| Q1 2010 | 119,920 | 129,220 | 124,200 | 144,870 |
| Q2 2010 | 116,170 | 124,098 | ||
| Q3 2010 | 111,490 | 122,495 | ||
| Q4 2010 | 106,730 | 119,108 | ||
| Q1 2011 | 107,890 | 124,003 | 117,700 | 137,390 |
| Q2 2011 | 109,470 | 128,960 | ||
| Q3 2011 | 109,830 | 133,259 | ||
| Q4 2011 | 114,030 | 138,861 | ||
| Q1 2012 | 118,510 | 143,409 | 128,160 | 134,900 |
| Q2 2012 | 118,580 | 144,306 | ||
| Q3 2012 | 118,350 | 142,265 | ||
| Q4 2012 | 115,590 | 137,912 | ||
| Q1 2013 | 107,980 | 130,167 | 118,540 | 124,720 |
| Q2 2013 | 106,960 | 128,671 | ||
| Q3 2013 | 108,270 | 128,456 | ||
| Q4 2013 | 109,450 | 133,897 | ||
| Q1 2014 | 112,330 | 137,432 | 130,340 | 136,610 |
| Q2 2014 | 114,070 | 141,709 | ||
| Q3 2014 | 115,730 | 147,167 | ||
| Q4 2014 | 117,820 | 152,105 | ||
| Q1 2015 | 124,650 | 167,184 | 155,080 | 170,690 |
| Q2 2015 | 131,430 | 177,967 | ||
| Q3 2015 | 135,850 | 187,396 | ||
| Q4 2015 | 142,480 | 194,148 | ||
| Q1 2016 | 139,720 | 191,799 | 163,940 | 189,650 |
| Q2 2016 | 138,850 | 198,198 | ||
| Q3 2016 | 142,490 | 204,325 | ||
| Q4 2016 | 141,880 | 210,474 | ||
| Q1 2017 | 147,520 | 214,090 | 183,570 | 217,350 |
| Q2 2017 | 153,420 | 213,382 | ||
| Q3 2017 | 154,590 | 214,478 | ||
| Q4 2017 | 162,470 | 218,289 | ||
| Q1 2018 | 160,900 | 221,683 | 195,390 | 222,280 |
| Q2 2018 | 161,220 | 231,037 | ||
| Q3 2018 | 162,900 | 236,554 | ||
| Q4 2018 | 165,490 | 244,319 | ||
| Q1 2019 | 169,060 | 249,921 | 214,413 | 241,877 |
| Q2 2019 | 172,890 | 251,818 | ||
| Q3 2019 | 177,030 | 254,520 | ||
| Q4 2019 | 177,880 | 255,206 | ||
| Q1 2020 | 175,340 | 254,718 | 219,120 | 242,702 |
| Q2 2020 | 145,670 | 217,066 | ||
| Q3 2020 | 145,100 | 218,407 | ||
| Q4 2020 | 147,890 | 215,402 | ||
| Q1 2021 | 155,950 | 220,726 | 194,063 | 216,489 |
| Q2 2021 | 183,430 | 252,051 | ||
| Q3 2021 | 182,380 | 247,934 | ||
| Q4 2021 | 175,390 | 243,775 |
Table: Relationship between EPCs and net additional dwellings across England (data for fig 1)
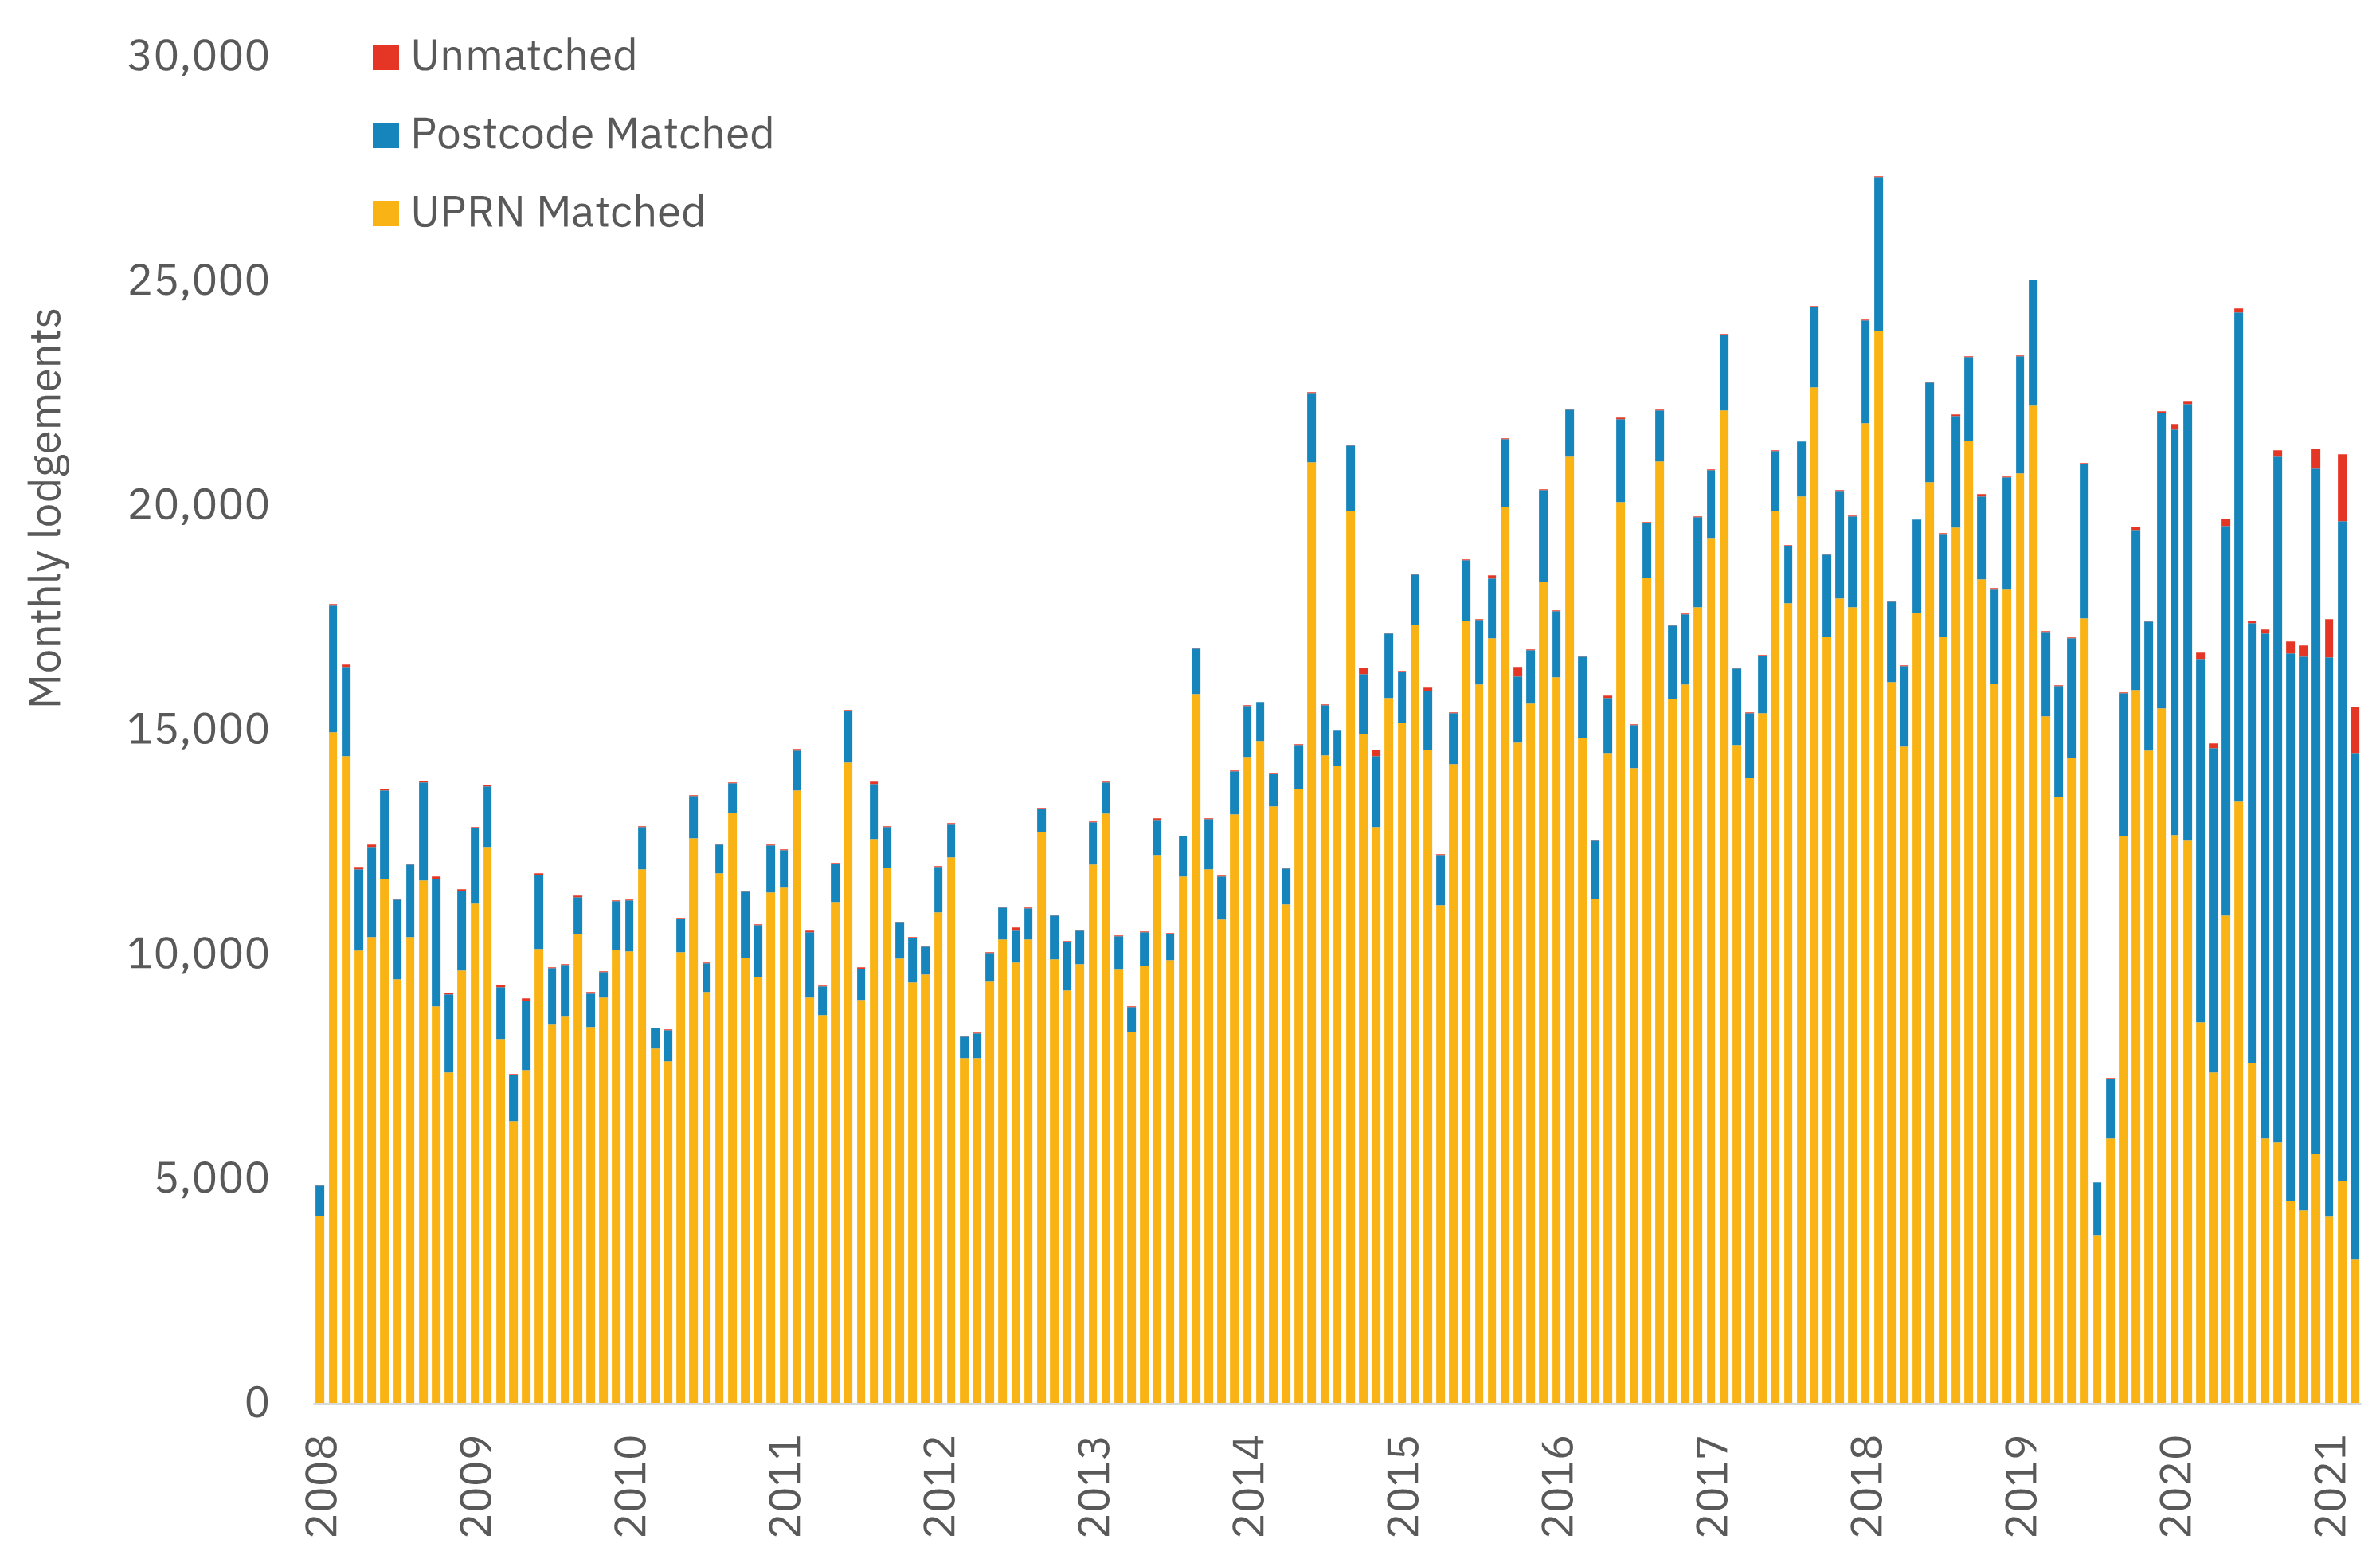
DLUHC have just started publishing UPRNs alongside each EPC record. Using these records alongside ONS lookups allow us to map new build to exact locations (fig 2, below).
However, the match rate for new build is not great in recent periods given the challenges in matching newly created addresses.
Therefore we have used UPRNs where available but then matched against full postcode when not.
For 2021 this resulted in:
- UPRN matched: 35 per cent
- Postcode matched: 63 per cent
- Unmatched: 2 per cent
| Date | UPRN matched | Postcode matched | Unmatched |
|---|---|---|---|
| Oct-08 | 4,191 | 679 | 17 |
| Nov-08 | 14,964 | 2,817 | 47 |
| Dec-08 | 14,429 | 2,002 | 53 |
| Jan-09 | 10,097 | 1,821 | 49 |
| Feb-09 | 10,406 | 2,013 | 54 |
| Mar-09 | 11,707 | 1,957 | 40 |
| Apr-09 | 9,458 | 1,785 | 5 |
| May-09 | 10,405 | 1,619 | 15 |
| Jun-09 | 11,669 | 2,188 | 35 |
| Jul-09 | 8,871 | 2,838 | 43 |
| Aug-09 | 7,398 | 1,737 | 22 |
| Sep-09 | 9,668 | 1,769 | 33 |
| Oct-09 | 11,157 | 1,686 | 15 |
| Nov-09 | 12,406 | 1,361 | 25 |
| Dec-09 | 8,141 | 1,153 | 45 |
| Jan-10 | 6,301 | 1,040 | 15 |
| Feb-10 | 7,447 | 1,549 | 51 |
| Mar-10 | 10,133 | 1,653 | 37 |
| Apr-10 | 8,453 | 1,268 | 19 |
| May-10 | 8,633 | 1,154 | 13 |
| Jun-10 | 10,470 | 832 | 32 |
| Jul-10 | 8,407 | 744 | 29 |
| Aug-10 | 9,052 | 570 | 8 |
| Sep-10 | 10,124 | 1,081 | 14 |
| Oct-10 | 10,096 | 1,119 | 14 |
| Nov-10 | 11,909 | 955 | 2 |
| Dec-10 | 7,928 | 462 | |
| Jan-11 | 7,636 | 687 | 11 |
| Feb-11 | 10,076 | 740 | 2 |
| Mar-11 | 12,607 | 939 | 2 |
| Apr-11 | 9,180 | 647 | 5 |
| May-11 | 11,832 | 626 | 12 |
| Jun-11 | 13,183 | 655 | 17 |
| Jul-11 | 9,953 | 1,471 | 3 |
| Aug-11 | 9,514 | 1,164 | 16 |
| Sep-11 | 11,396 | 1,057 | 3 |
| Oct-11 | 11,513 | 835 | 14 |
| Nov-11 | 13,677 | 885 | 37 |
| Dec-11 | 9,064 | 1,452 | 26 |
| Jan-12 | 8,668 | 632 | 8 |
| Feb-12 | 11,187 | 850 | 7 |
| Mar-12 | 14,301 | 1,139 | 13 |
| Apr-12 | 9,009 | 696 | 21 |
| May-12 | 12,598 | 1,223 | 48 |
| Jun-12 | 11,943 | 917 | 7 |
| Jul-12 | 9,926 | 794 | 24 |
| Aug-12 | 9,388 | 1,002 | 8 |
| Sep-12 | 9,567 | 624 | 3 |
| Oct-12 | 10,964 | 1,013 | 12 |
| Nov-12 | 12,183 | 737 | 33 |
| Dec-12 | 7,715 | 467 | 26 |
| Jan-13 | 7,707 | 559 | 11 |
| Feb-13 | 9,410 | 637 | 11 |
| Mar-13 | 10,351 | 711 | 20 |
| Apr-13 | 9,837 | 706 | 77 |
| May-13 | 10,357 | 685 | 14 |
| Jun-13 | 12,752 | 514 | 12 |
| Jul-13 | 9,914 | 971 | 6 |
| Aug-13 | 9,211 | 1,091 | 15 |
| Sep-13 | 9,802 | 750 | 5 |
| Oct-13 | 12,015 | 956 | 9 |
| Nov-13 | 13,165 | 686 | 25 |
| Dec-13 | 9,671 | 749 | 10 |
| Jan-14 | 8,299 | 545 | 1 |
| Feb-14 | 9,770 | 747 | 6 |
| Mar-14 | 12,235 | 778 | 31 |
| Apr-14 | 9,892 | 584 | 7 |
| May-14 | 11,764 | 902 | |
| Jun-14 | 15,811 | 1,011 | 7 |
| Jul-14 | 11,916 | 1,110 | 32 |
| Aug-14 | 10,792 | 960 | 10 |
| Sep-14 | 13,148 | 950 | 11 |
| Oct-14 | 14,420 | 1,126 | 8 |
| Nov-14 | 14,780 | 868 | |
| Dec-14 | 13,321 | 715 | 8 |
| Jan-15 | 11,140 | 786 | 2 |
| Feb-15 | 13,701 | 981 | 9 |
| Mar-15 | 20,988 | 1,546 | 1 |
| Apr-15 | 14,459 | 1,117 | 5 |
| May-15 | 14,229 | 800 | |
| Jun-15 | 19,894 | 1,460 | 22 |
| Jul-15 | 14,940 | 1,324 | 138 |
| Aug-15 | 12,848 | 1,587 | 145 |
| Sep-15 | 15,729 | 1,447 | 11 |
| Oct-15 | 15,180 | 1,129 | 20 |
| Nov-15 | 17,358 | 1,121 | 3 |
| Dec-15 | 14,572 | 1,326 | 71 |
| Jan-16 | 11,121 | 1,108 | 3 |
| Feb-16 | 14,254 | 1,136 | 4 |
| Mar-16 | 17,444 | 1,361 | 15 |
| Apr-16 | 16,024 | 1,450 | 4 |
| May-16 | 17,066 | 1,319 | 71 |
| Jun-16 | 19,985 | 1,504 | 1 |
| Jul-16 | 14,740 | 1,474 | 209 |
| Aug-16 | 15,601 | 1,187 | 2 |
| Sep-16 | 18,315 | 2,039 | 3 |
| Oct-16 | 16,195 | 1,466 | 11 |
| Nov-16 | 21,106 | 1,045 | 5 |
| Dec-16 | 14,837 | 1,825 | 7 |
| Jan-17 | 11,255 | 1,306 | 16 |
| Feb-17 | 14,501 | 1,225 | 52 |
| Mar-17 | 20,094 | 1,849 | 27 |
| Apr-17 | 14,160 | 974 | 1 |
| May-17 | 18,411 | 1,222 | 3 |
| Jun-17 | 20,996 | 1,149 | 12 |
| Jul-17 | 15,715 | 1,632 | 8 |
| Aug-17 | 16,038 | 1,559 | 10 |
| Sep-17 | 17,756 | 2,004 | 2 |
| Oct-17 | 19,303 | 1,507 | 5 |
| Nov-17 | 22,131 | 1,686 | 10 |
| Dec-17 | 14,690 | 1,692 | 5 |
| Jan-18 | 13,961 | 1,438 | 4 |
| Feb-18 | 15,388 | 1,277 | 6 |
| Mar-18 | 19,907 | 1,330 | 9 |
| Apr-18 | 17,843 | 1,280 | 5 |
| May-18 | 20,213 | 1,229 | |
| Jun-18 | 22,651 | 1,784 | 18 |
| Jul-18 | 17,090 | 1,832 | 20 |
| Aug-18 | 17,954 | 2,390 | 5 |
| Sep-18 | 17,752 | 2,030 | 3 |
| Oct-18 | 21,859 | 2,289 | 17 |
| Nov-18 | 23,907 | 3,420 | 6 |
| Dec-18 | 16,093 | 1,784 | 12 |
| Jan-19 | 14,655 | 1,791 | 7 |
| Feb-19 | 17,624 | 2,073 | |
| Mar-19 | 20,548 | 2,205 | 19 |
| Apr-19 | 17,105 | 2,277 | 30 |
| May-19 | 19,530 | 2,490 | 25 |
| Jun-19 | 21,461 | 1,856 | 21 |
| Jul-19 | 18,375 | 1,847 | 51 |
| Aug-19 | 16,056 | 2,104 | 5 |
| Sep-19 | 18,157 | 2,482 | 11 |
| Oct-19 | 20,733 | 2,602 | 2 |
| Nov-19 | 22,235 | 2,812 | |
| Dec-19 | 15,325 | 1,880 | 6 |
| Jan-20 | 13,535 | 2,463 | 4 |
| Feb-20 | 14,401 | 2,662 | 9 |
| Mar-20 | 17,513 | 3,433 | 2 |
| Apr-20 | 3,767 | 1,170 | |
| May-20 | 5,914 | 1,340 | 8 |
| Jun-20 | 12,669 | 3,171 | 16 |
| Jul-20 | 15,914 | 3,556 | 74 |
| Aug-20 | 14,566 | 2,871 | 7 |
| Sep-20 | 15,501 | 6,589 | 33 |
| Oct-20 | 12,678 | 9,037 | 122 |
| Nov-20 | 12,548 | 9,735 | 70 |
| Dec-20 | 8,510 | 8,097 | 127 |
| Jan-21 | 7,388 | 7,231 | 92 |
| Feb-21 | 10,885 | 8,681 | 151 |
| Mar-21 | 13,420 | 10,905 | 86 |
| Apr-21 | 7,611 | 9,782 | 61 |
| May-21 | 5,917 | 11,258 | 75 |
| Jun-21 | 5,822 | 15,277 | 156 |
| Jul-21 | 4,540 | 12,184 | 261 |
| Aug-21 | 4,324 | 12,323 | 246 |
| Sep-21 | 5,580 | 15,254 | 453 |
| Oct-21 | 4,179 | 12,455 | 855 |
| Nov-21 | 4,976 | 14,686 | 1,495 |
| Dec-21 | 3,225 | 11,281 | 1,034 |
Table: Mapping new builds to location (data for fig 2)
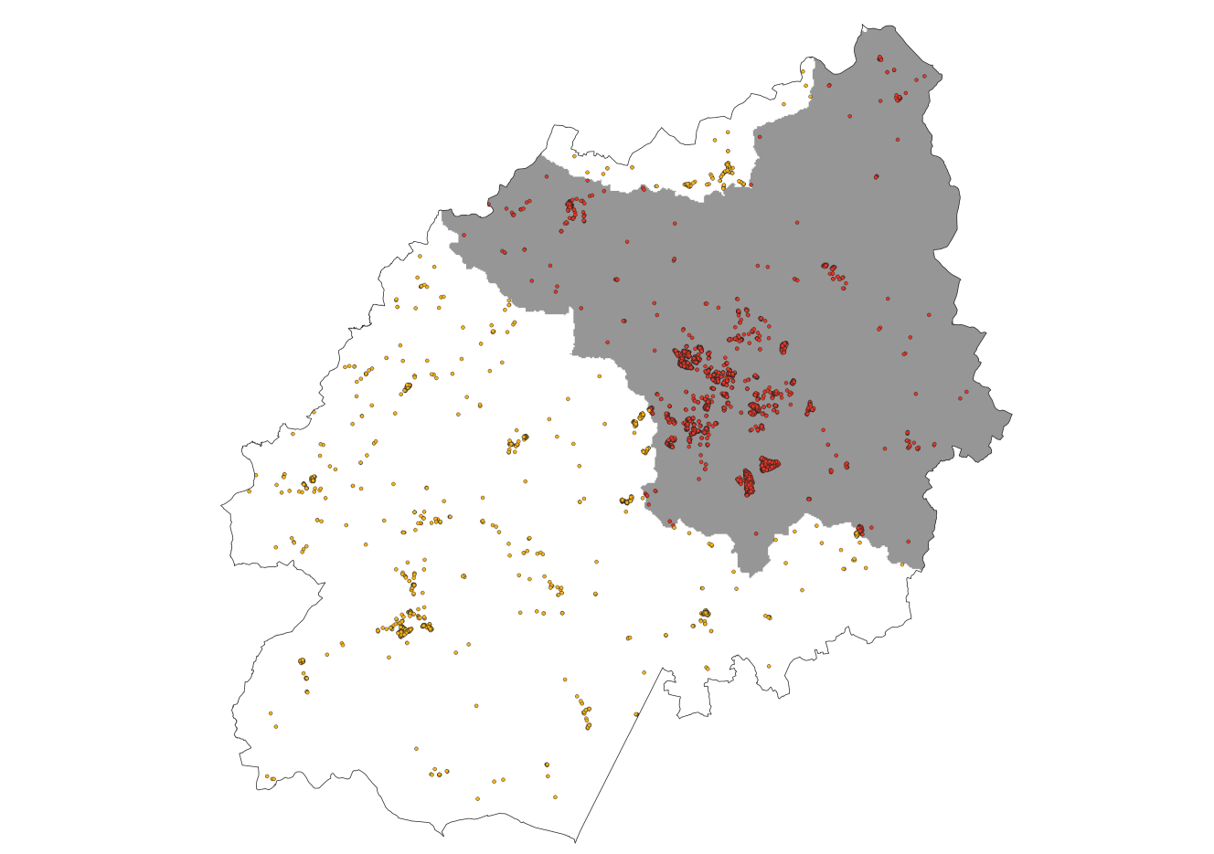
The map below (fig 3) shows patterns in new housing supply across Ashford district. Please note that the map does not show the scale of delivery in different locations as there may be multiple homes in a single location (e.g. flats or houses mapped to postcode).
The Stodmarsh SAC/Ramsar advice area is then highlighted in grey.
New build locations falling within the advice area are highlighted in red while those outside are in yellow.
Headline results
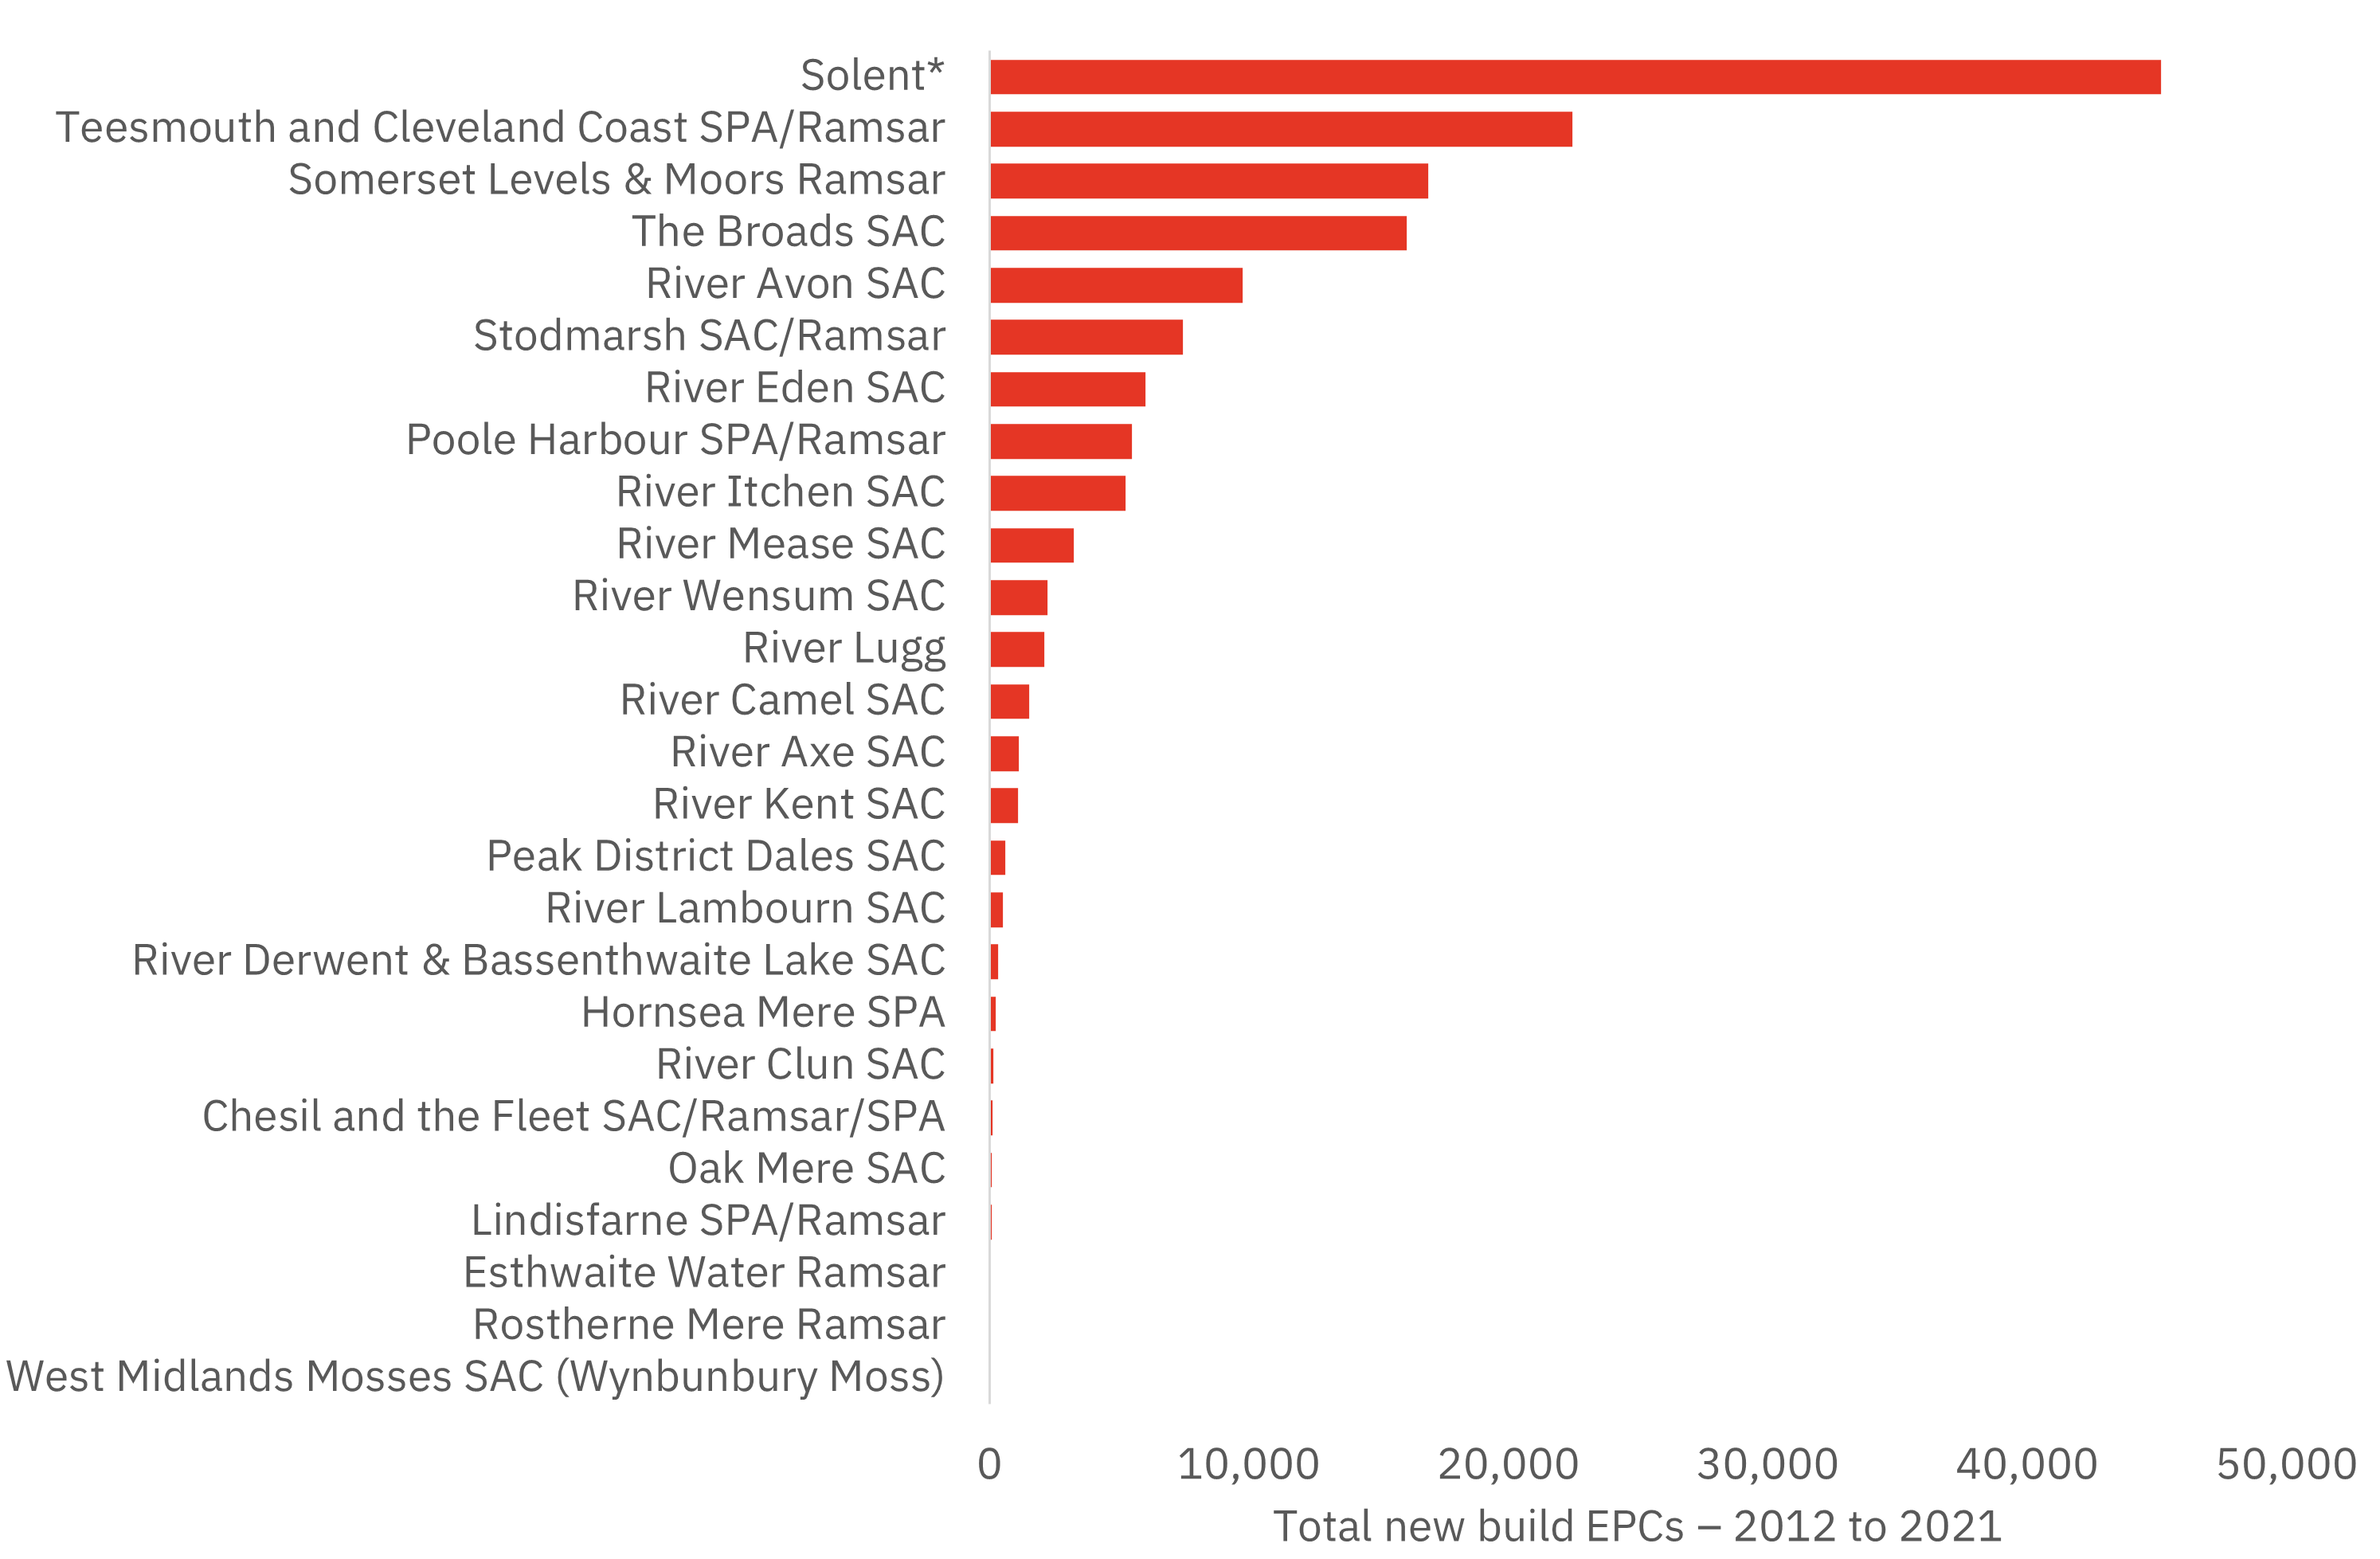
Our initial analysis identifies the number of new build EPCs in each advice area over the last ten years (see fig 4, below).
The results vary in scale from over 45,000 homes during the ten year period in the Solent* advice area to just 2 homes over the period in the West Midlands Mosses SAC.
(*Solent includes: Chichester and Langstone Harbours SPA/Ramsar, Solent and Southampton Water SPA/Ramsar, Solent Maritime SAC, Solent and Dorset Coast SPA, Solent and Isle of Wight Lagoon SAC, Portsmouth Harbour SPA/Ramsar)
| Location | Total new build APCs: 2012-2021 |
|---|---|
| West Midlands Mosses SAC (Wynbunbury Moss) | 2 |
| Rostherne Mere Ramsar | 10 |
| Esthwaite Water Ramsar | 14 |
| Lindisfarne SPA/Ramsar | 73 |
| Oak Mere SAC | 78 |
| Chesil and the Fleet SAC/Ramsar/SPA | 127 |
| River Clun SAC | 143 |
| Hornsea Mere SPA | 248 |
| River Derwent & Bassenthwaite Lake SAC | 332 |
| River Lambourn SAC | 509 |
| Peak District Dales SAC | 599 |
| River Kent SAC | 1,113 |
| River Axe SAC | 1,134 |
| River Camel SAC | 1,531 |
| River Lugg | 2,119 |
| River Wensum SAC | 2,224 |
| River Mease SAC | 3,247 |
| River Itchen SAC | 5,259 |
| Poole Harbour SPA/Ramsar | 5,494 |
| River Eden SAC | 6,002 |
| Stodmarsh SAC/Ramsar | 7,453 |
| River Avon SAC | 9,745 |
| The Broads SAC | 16,079 |
| Somerset Levels & Moors Ramsar | 16,900 |
| Teesmouth and Cleveland Coast SPA/Ramsar | 22,463 |
| Solent* | 45,153 |
Table: Number of new build EPCs in advice area over last decade (data for fig 4)
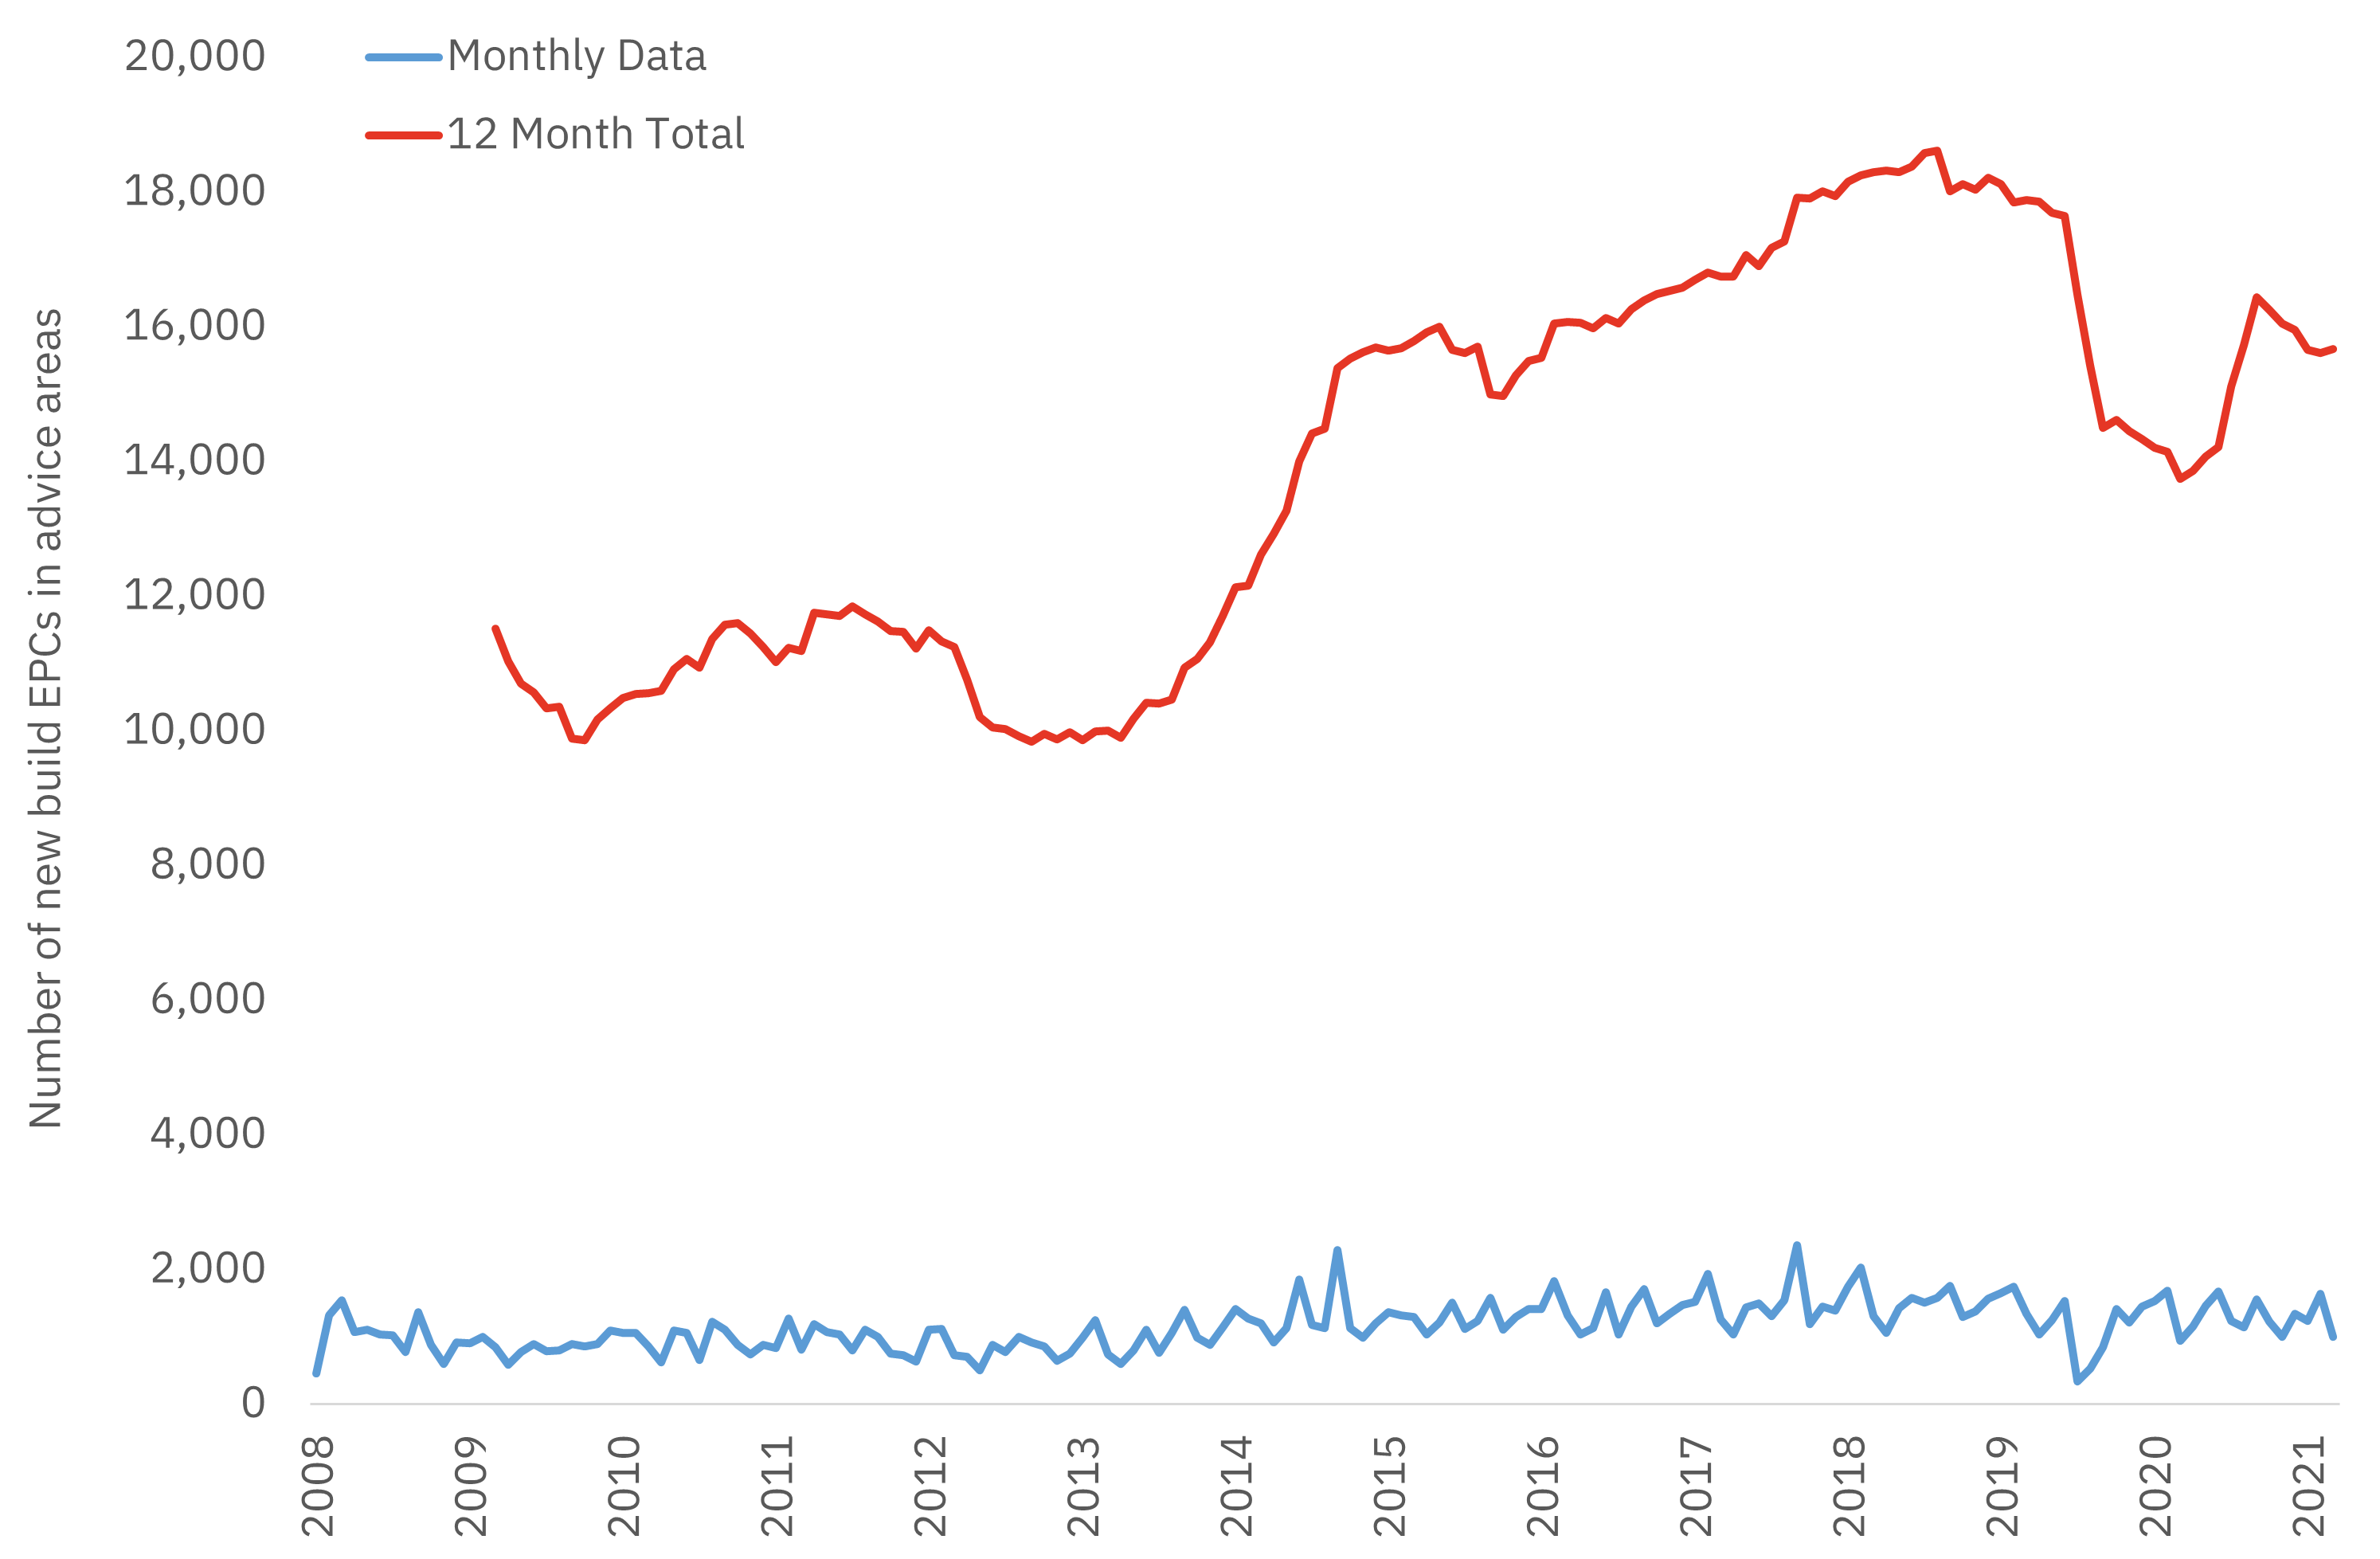
In aggregate, there were 15,700 EPCs on new homes in advice areas during 2021, slightly down from the 18,300 recorded in 2018 and the 17,900 recorded in 2019 (see fig 5, below).
EPCs in Advice Areas
| 2009 | 11,521 |
| 2010 | 10,558 |
| 2011 | 11,190 |
| 2012 | 11,244 |
| 2013 | 10,006 |
| 2014 | 12,612 |
| 2015 | 15,786 |
| 2016 | 16,068 |
| 2017 | 16,745 |
| 2018 | 18,299 |
| 2019 | 17,880 |
| 2020 | 13,740 |
| 2021 | 15,671 |
When compared to total delivery across England, these homes accounted for around 7 per cent of new build EPCs in recent years (fig 6, below).
EPCs in Advice Areas
| 2009 | 8.02% |
| 2010 | 8.68% |
| 2011 | 7.94% |
| 2012 | 8.16% |
| 2013 | 7.50% |
| 2014 | 8.06% |
| 2015 | 7.89% |
| 2016 | 7.51% |
| 2017 | 7.51% |
| 2018 | 7.41% |
| 2019 | 7.20% |
| 2020 | 6.80% |
| 2021 | 6.99% |
Regional results
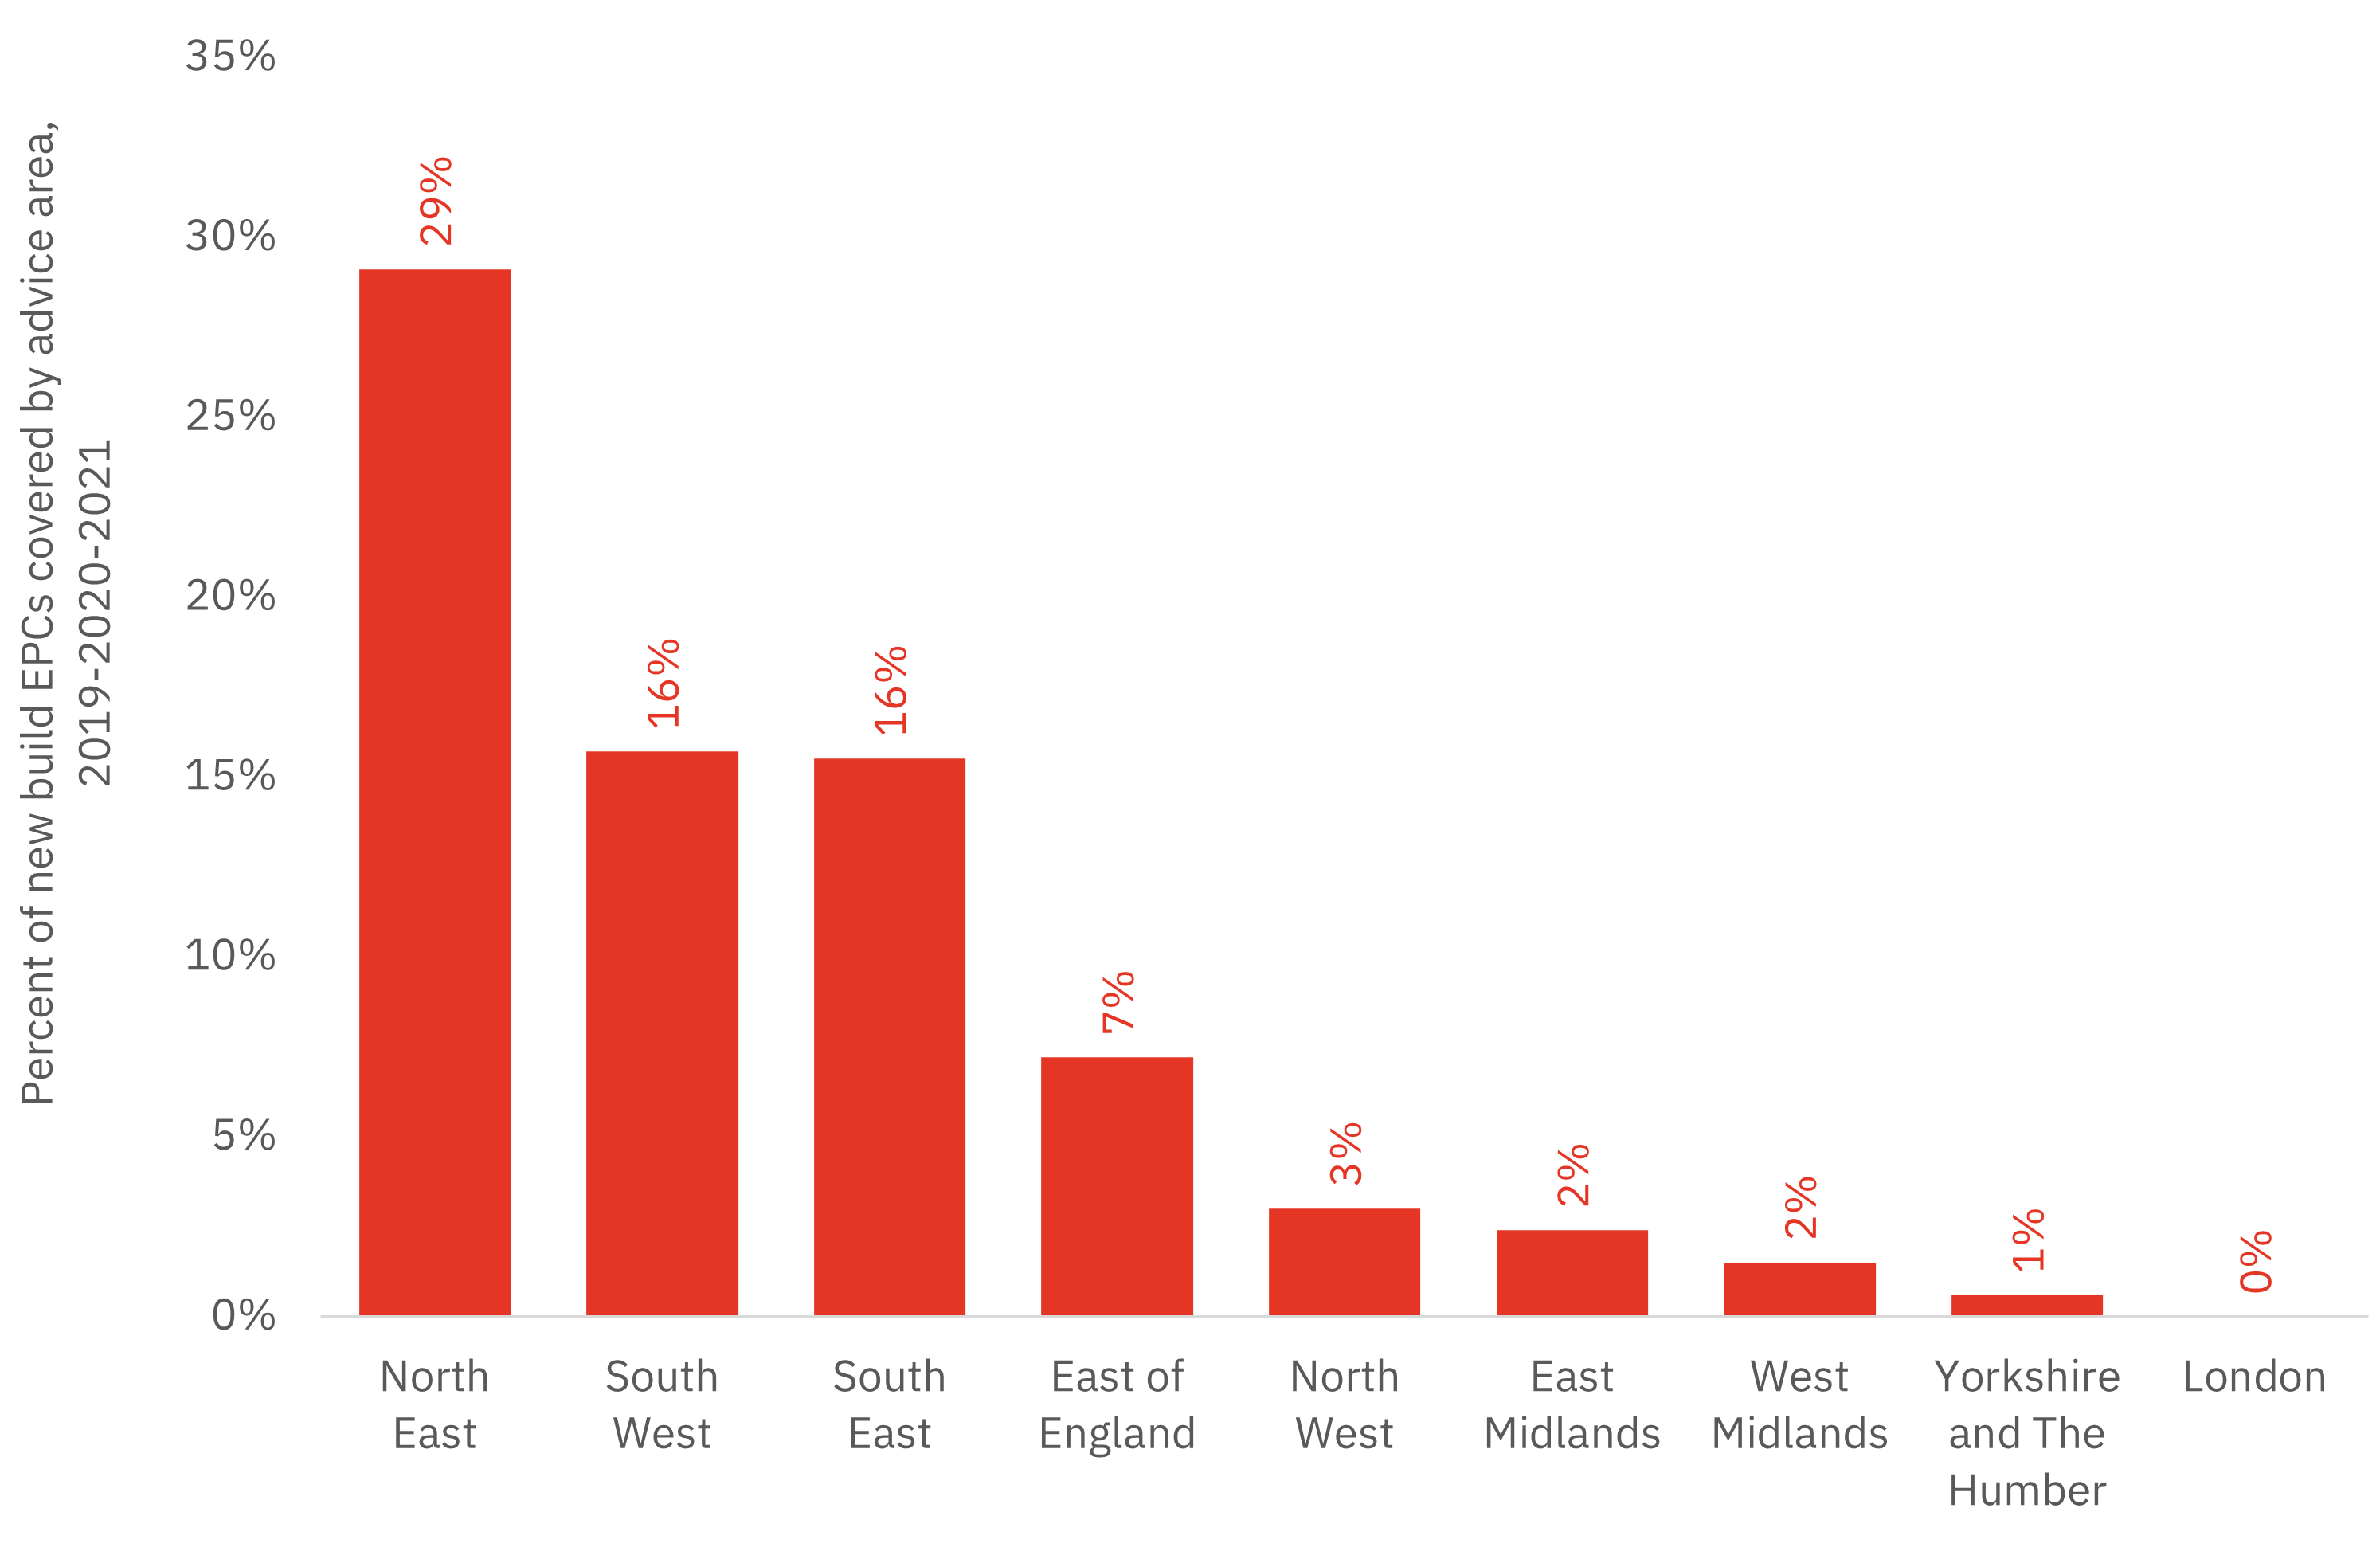
The regional impact of the advice areas is inevitably varied (see fig 7). The North East is the worst affected region with 29 per cent of recent new housing delivery falling with advice areas while 16 per cent of delivery in both the South West and South East is covered.
Meanwhile, the East of England (7 per cent) figure is similar to the national rate while the two Midlands regions are relatively unaffected at 2 per cent.
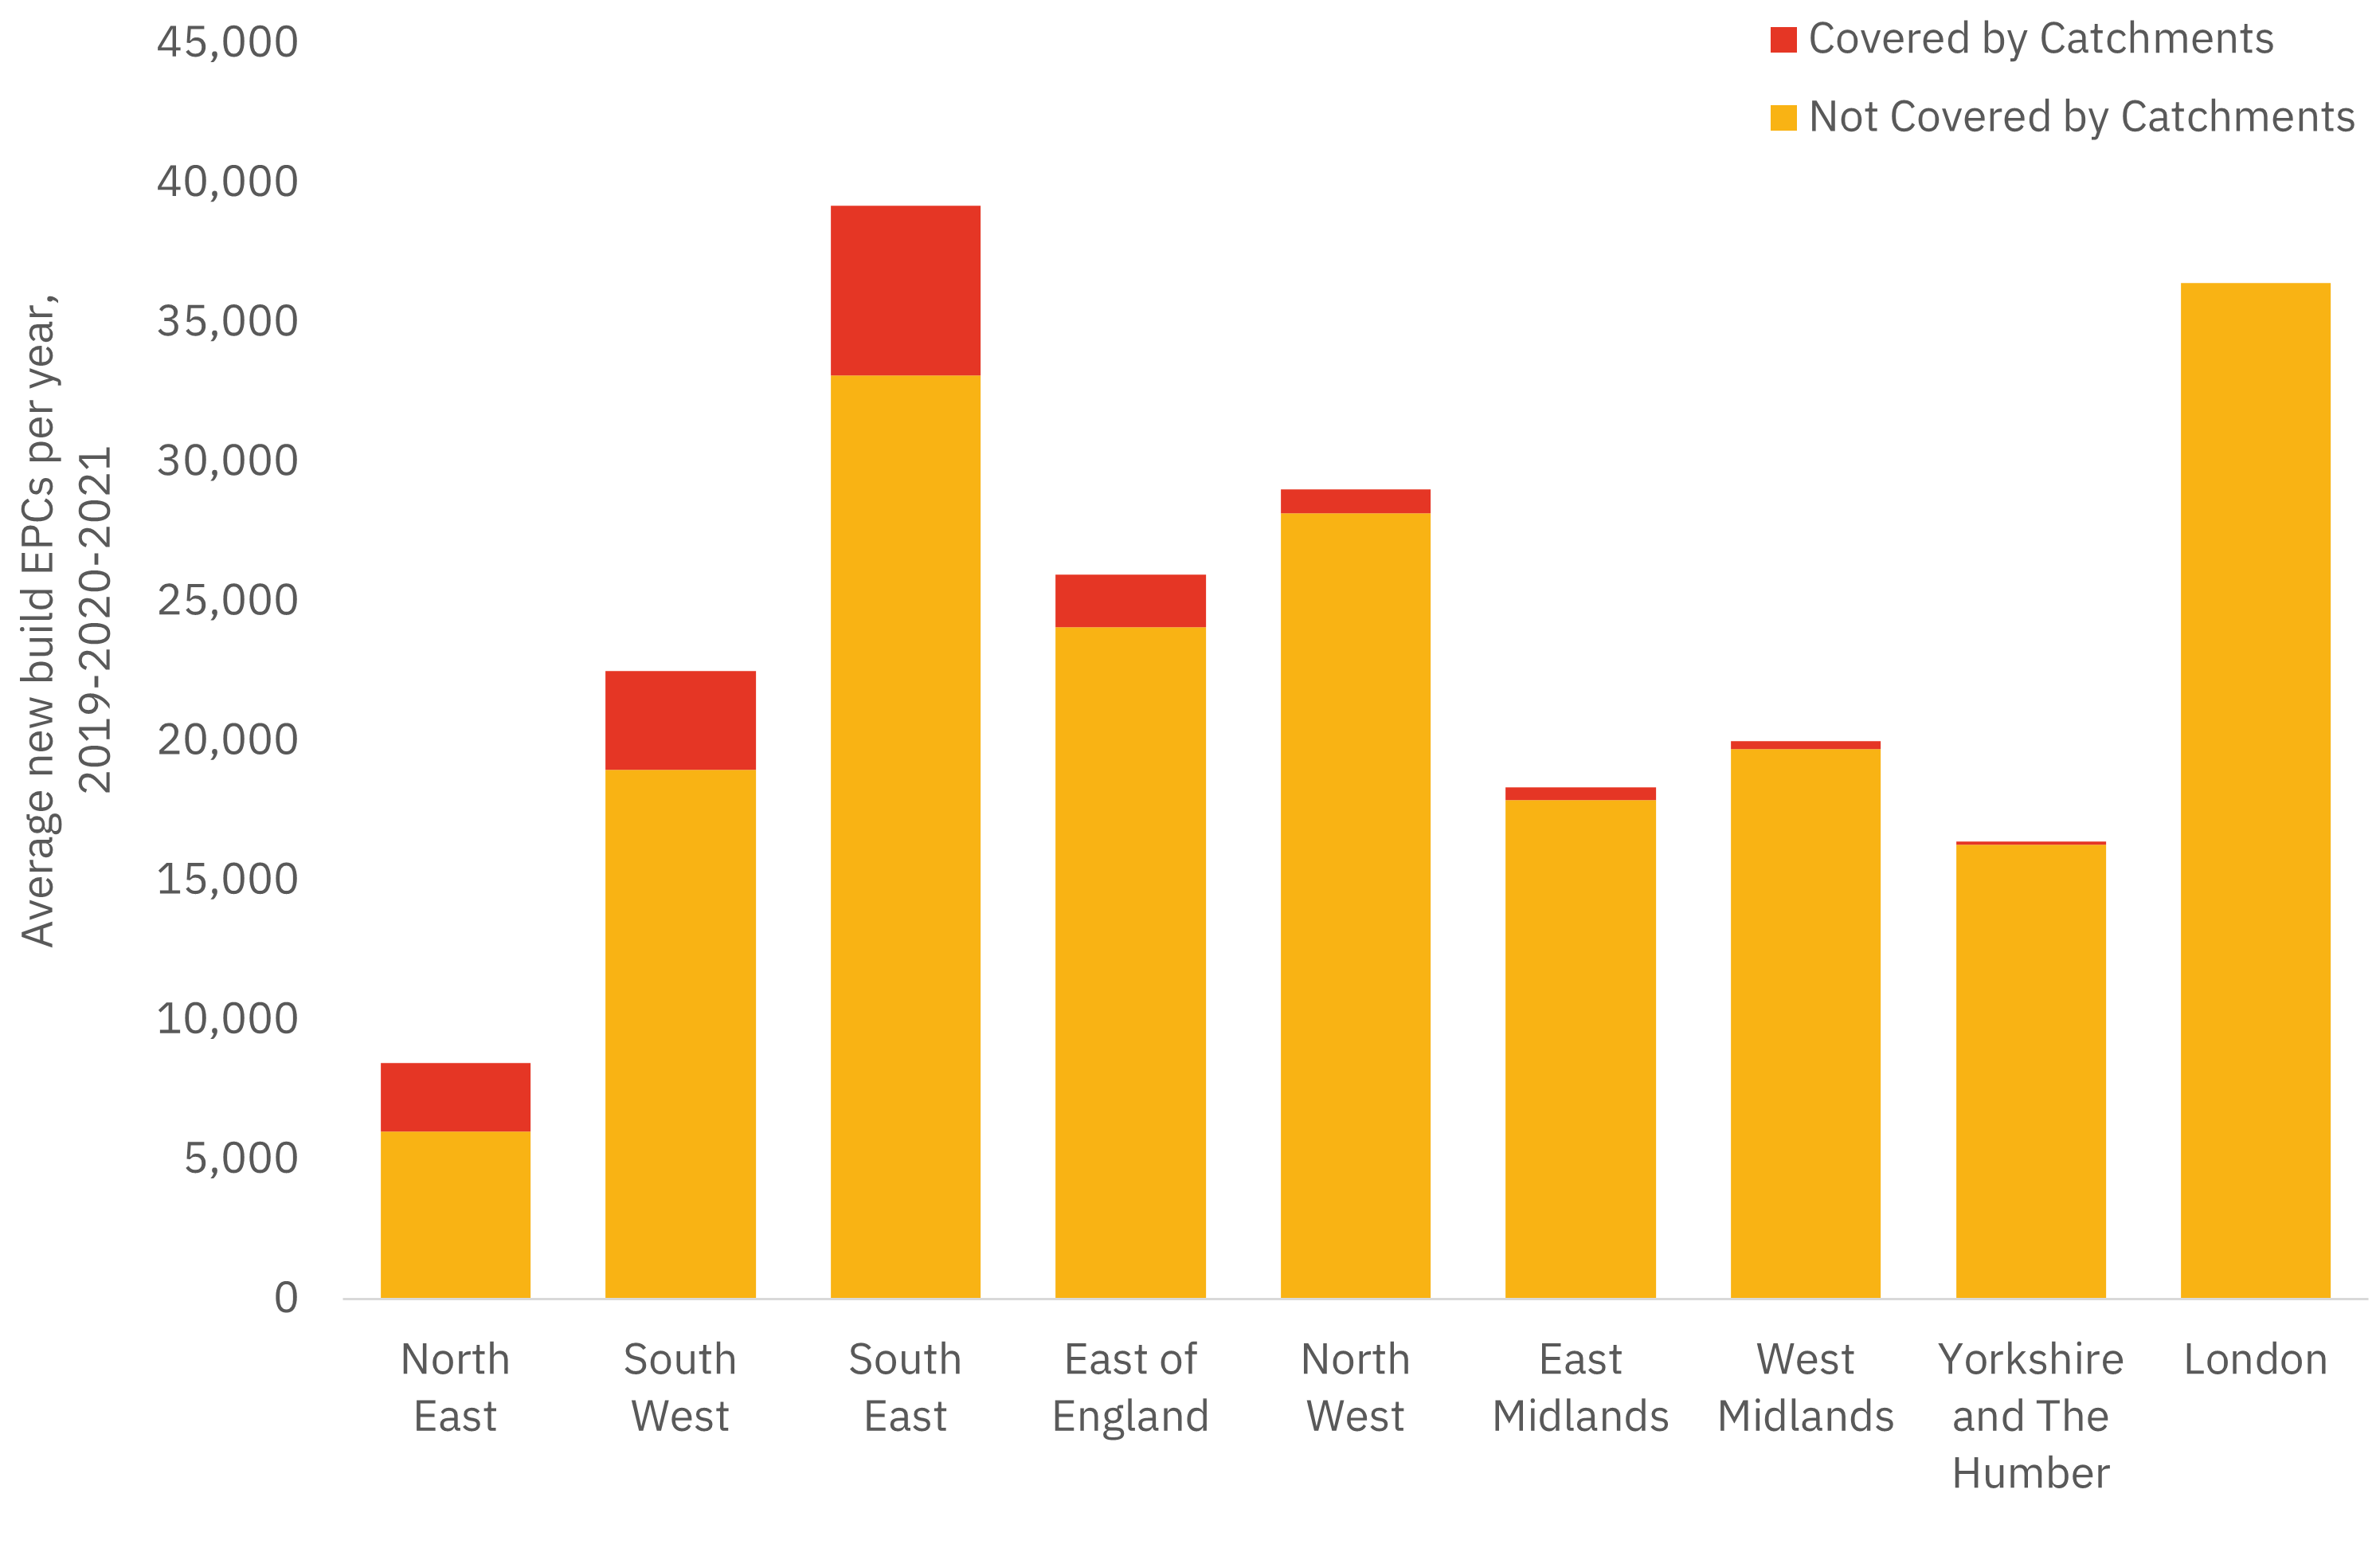
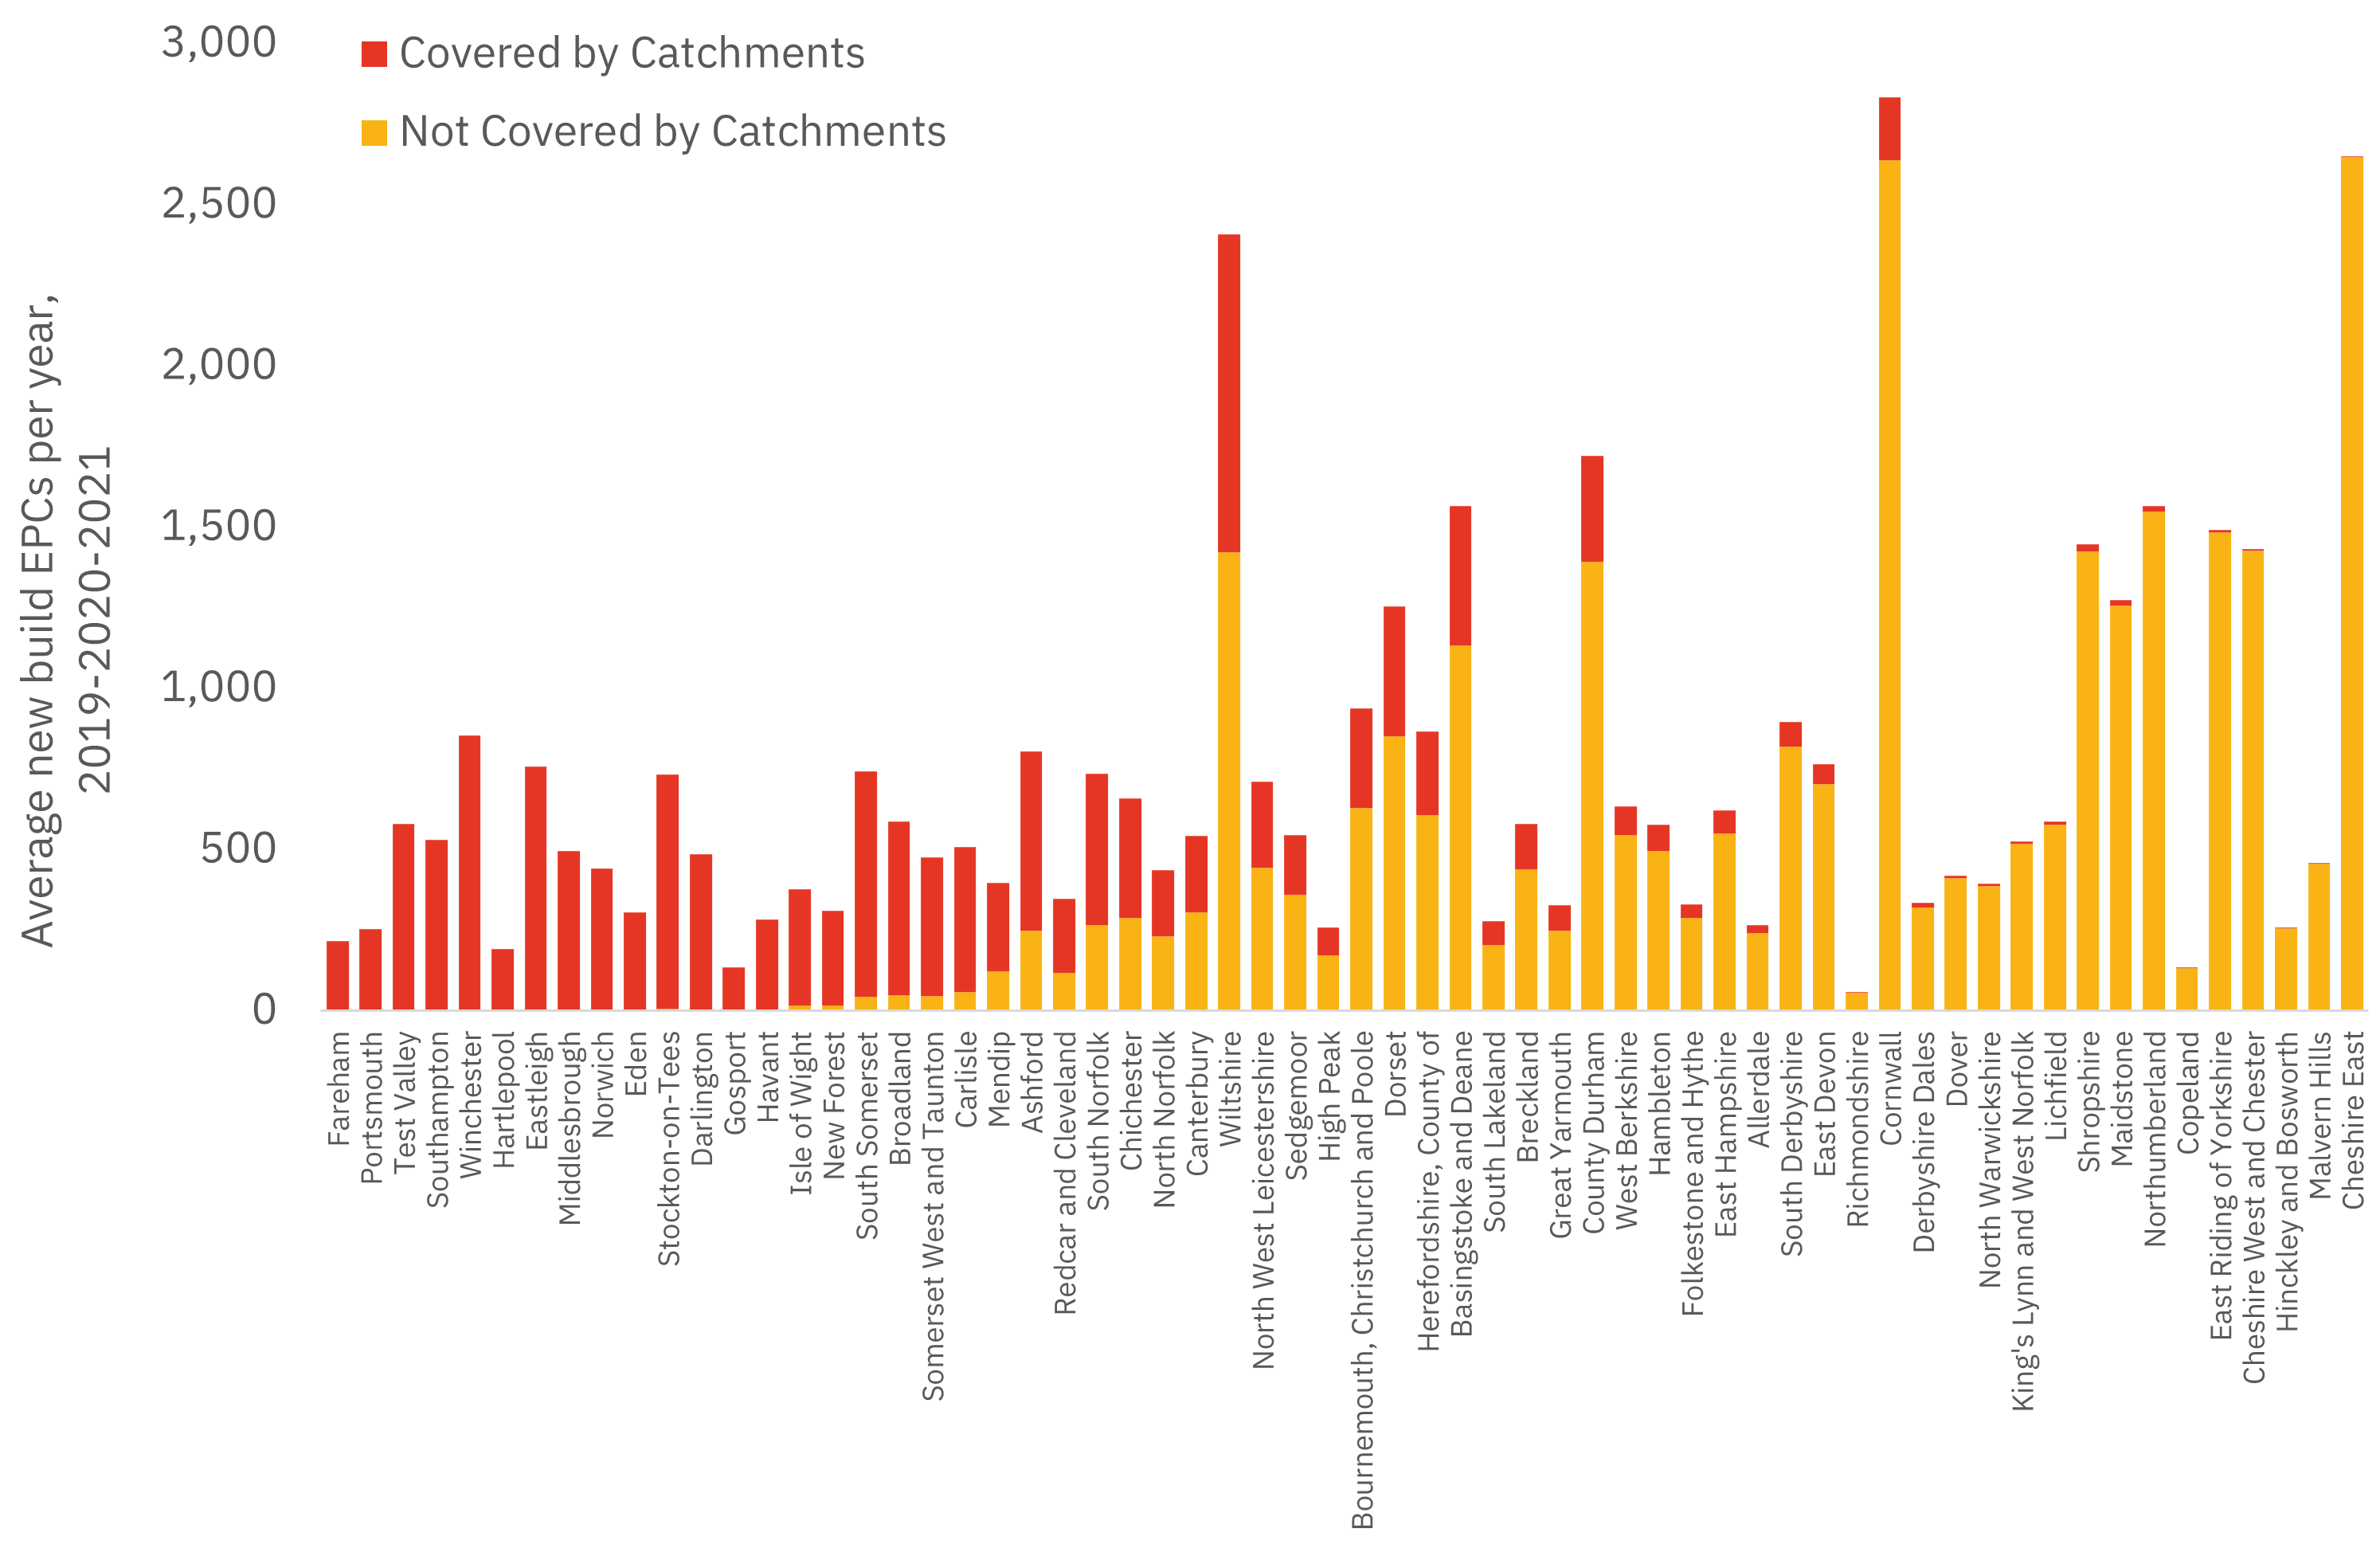
The chart below (fig 8) shows the underlying data used to calculate the percentage data shown in the previous slide and highlights the relative differences in new home delivery across regions.
While the North East has the highest proportion of delivery falling within advice areas, it is the smallest region with the lowest overall housing delivery. Therefore it has a minimal impact of headline national figures.
| Location | Not covered by catchments | Covered by catchments |
|---|---|---|
| North East |
6,005 | 2,465 |
| South West |
18,979 | 3,545 |
| South East |
33,118 | 6,081 |
| East of England | 24,100 | 1,879 |
| North West |
28,162 | 863 |
| East Midlands | 17,892 | 443 |
| West Midlands | 19,715 | 298 |
| Yorkshire and The Humber | 16,298 | 94 |
| London | 36,423 | 0 |
Table: Relative differences in new home delivery across regions (data for fig 8)
Local authority district results
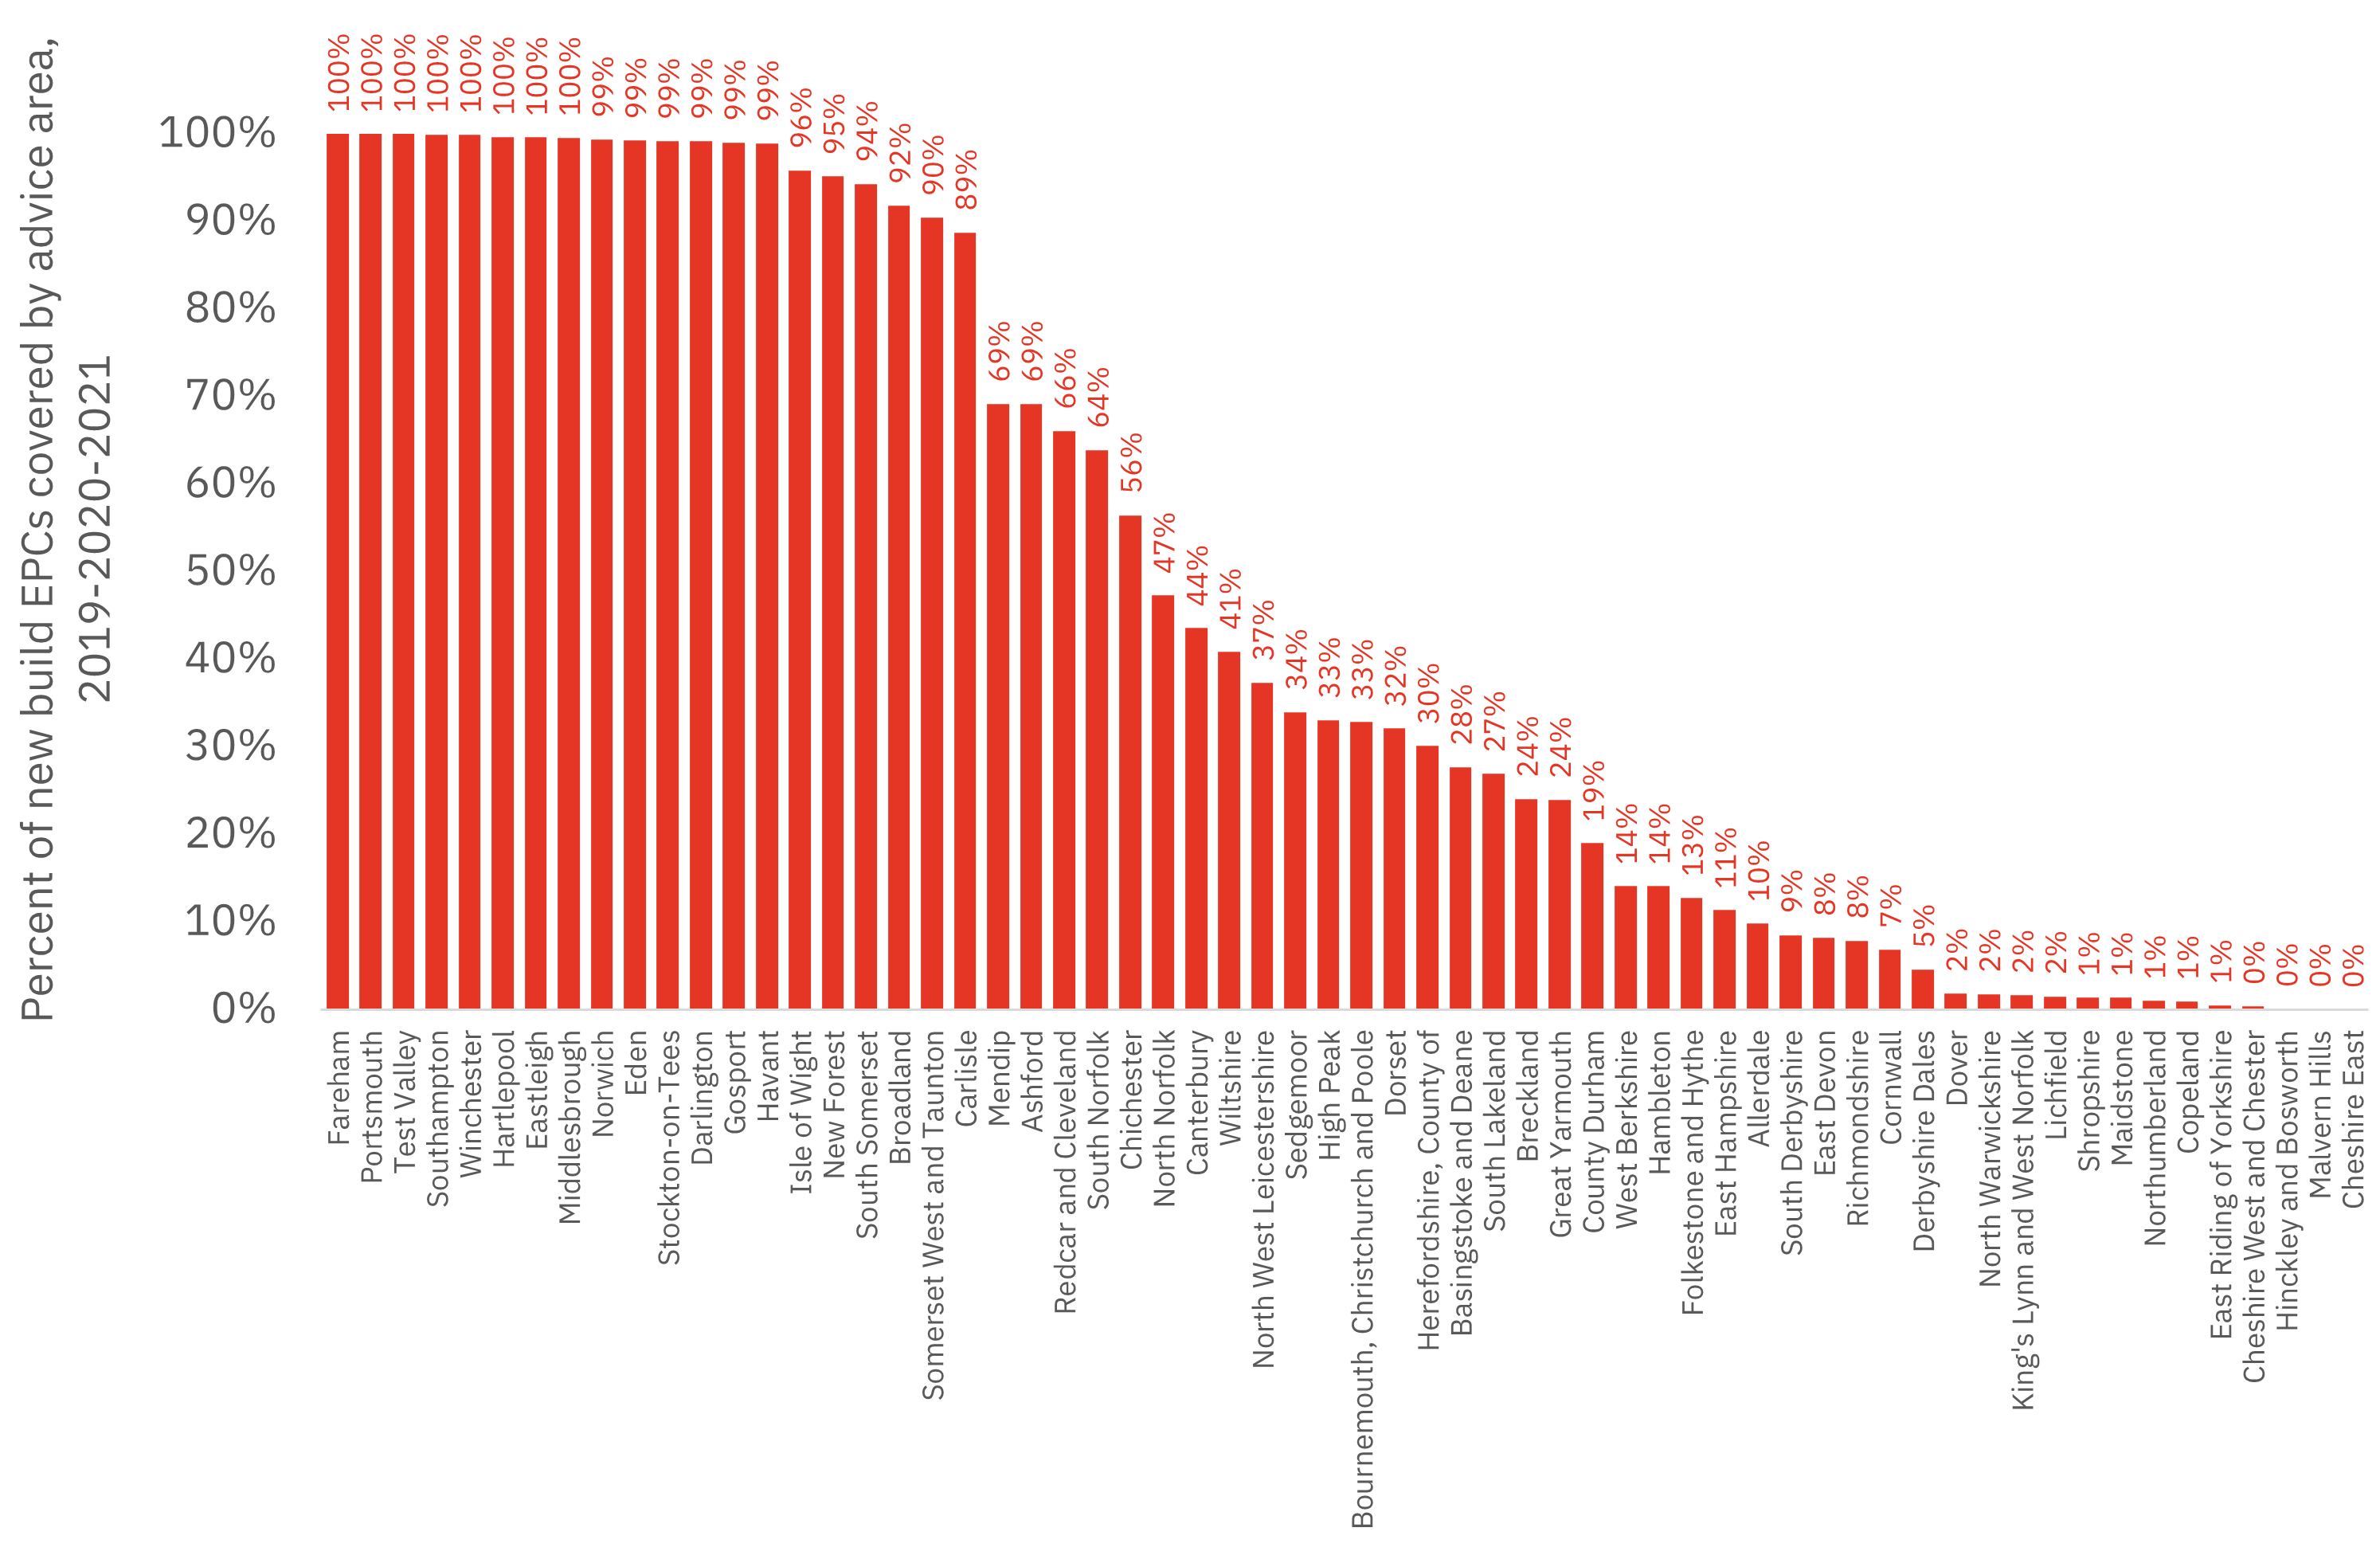
While around 7 per cent of new homes nationally fall into the advice areas, the impact on some local authorities is much more severe.
14 local authority districts have an advice area covering 99 per cent or more of their new housing delivered in the last three years. (see fig 9).
A further five have 89 per cent to 99 per cent of their new housing delivered in an advice area.
| Location | Per cent of new build EPCs covered by advice area |
|---|---|
| Fareham | 100% |
| Portsmouth | 100% |
| Test Valley | 100% |
| Southampton | 100% |
| Winchester | 100% |
| Hartlepool | 100% |
| Eastleigh | 100% |
| Middlesbrough | 100% |
| Norwich | 99% |
| Eden | 99% |
| Stockton-on-Tees | 99% |
| Darlington | 99% |
| Gosport | 99% |
| Havant | 99% |
| Isle of Wight | 96% |
| New Forest | 95% |
| South Somerset | 94% |
| Broadland | 92% |
| Somerset West and Taunton | 90% |
| Carlisle | 89% |
| Mendip | 69% |
| Ashford | 69% |
| Redcar and Cleveland | 66% |
| South Norfolk | 64% |
| Chichester | 56% |
| North Norfolk | 47% |
| Canterbury | 44% |
| Wiltshire | 41% |
| North West Leicestershire | 37% |
| Sedgemoor | 34% |
| High Peak | 33% |
| Bournemouth, Christchurch and Poole | 33% |
| Dorset | 32% |
| Herefordshire, County of | 30% |
| Basingstoke and Deane | 28% |
| South Lakeland | 27% |
| Breckland | 24% |
| Great Yarmouth | 24% |
| County Durham | 19% |
| West Berkshire | 14% |
| Hambleton | 14% |
| Folkestone and Hythe | 13% |
| East Hampshire | 11% |
| Allerdale | 10% |
| South Derbyshire | 9% |
| East Devon | 8% |
| Richmondshire | 8% |
| Cornwall | 7% |
| Derbyshire Dales | 5% |
| Dover | 2% |
| North Warwickshire | 2% |
| King's Lynn and West Norfolk | 2% |
| Lichfield | 2% |
| Shropshire | 1% |
| Maidstone | 1% |
| Northumberland | 1% |
| Copeland | 1% |
| East Riding of Yorkshire | 1% |
| Cheshire West and Chester | 0% |
| Hinckley and Bosworth | 0% |
| Malvern Hills | 0% |
| Cheshire East | 0% |
Table: Per cent of new build EPCs covered by advice area – LA district results (data for fig 9)
The chart below (fig 10) shows the underlying data used to calculate the percentage data shown in the previous slide and highlights the relative differences in new home delivery.
For example, while only 41 per cent of new homes in Wiltshire were within advice areas, the size of the district means that it has the largest number of new homes within an advice area.
| Location | Not covered by catchments | Covered by catchments |
|---|---|---|
| Fareham | 0 | 216 |
| Portsmouth | 0 | 253 |
| Test Valley | 0 | 579 |
| Southampton | 0 | 529 |
| Winchester | 1 | 852 |
| Hartlepool | 1 | 191 |
| Eastleigh | 3 | 755 |
| Middlesbrough | 2 | 494 |
| Norwich | 3 | 438 |
| Eden | 2 | 303 |
| Stockton-on-Tees | 6 | 726 |
| Darlington | 4 | 481 |
| Gosport | 1 | 134 |
| Havant | 3 | 280 |
| Isle of Wight | 16 | 362 |
| New Forest | 15 | 294 |
| South Somerset | 42 | 701 |
| Broadland | 48 | 538 |
| Somerset West and Taunton | 45 | 429 |
| Carlisle | 57 | 451 |
| Mendip | 122 | 275 |
| Ashford | 248 | 557 |
| Redcar and Cleveland | 118 | 229 |
| South Norfolk | 265 | 470 |
| Chichester | 287 | 372 |
| North Norfolk | 230 | 207 |
| Canterbury | 306 | 236 |
| Wiltshire | 1,423 | 986 |
| North West Leicestershire | 444 | 265 |
| Sedgemoor | 360 | 185 |
| High Peak | 173 | 85 |
| Bournemouth, Christchurch and Poole | 629 | 308 |
| Dorset | 851 | 403 |
| Herefordshire, County of | 606 | 261 |
| Basingstoke and Deane | 1,132 | 434 |
| South Lakeland | 203 | 75 |
| Breckland | 439 | 139 |
| Great Yarmouth | 249 | 78 |
| County Durham | 1,393 | 327 |
| West Berkshire | 545 | 90 |
| Hambleton | 495 | 81 |
| Folkestone and Hythe | 288 | 42 |
| East Hampshire | 551 | 71 |
| Allerdale | 240 | 26 |
| South Derbyshire | 820 | 77 |
| East Devon | 703 | 63 |
| Richmondshire | 54 | 5 |
| Cornwall | 2,638 | 195 |
| Derbyshire Dales | 320 | 15 |
| Dover | 411 | 8 |
| North Warwickshire | 386 | 7 |
| King's Lynn and West Norfolk | 517 | 9 |
| Lichfield | 577 | 9 |
| Shropshire | 1,425 | 21 |
| Maidstone | 1,256 | 18 |
| Northumberland | 1,548 | 16 |
| Copeland | 132 | 1 |
| East Riding of Yorkshire | 1,483 | 8 |
| Cheshire West and Chester | 1,427 | 6 |
| Hinckley and Bosworth | 255 | 0 |
| Malvern Hills | 455 | 0 |
| Cheshire East | 2,647 | 1 |
Table: Relative differences in new home delivery – LA district results (data for fig 10)
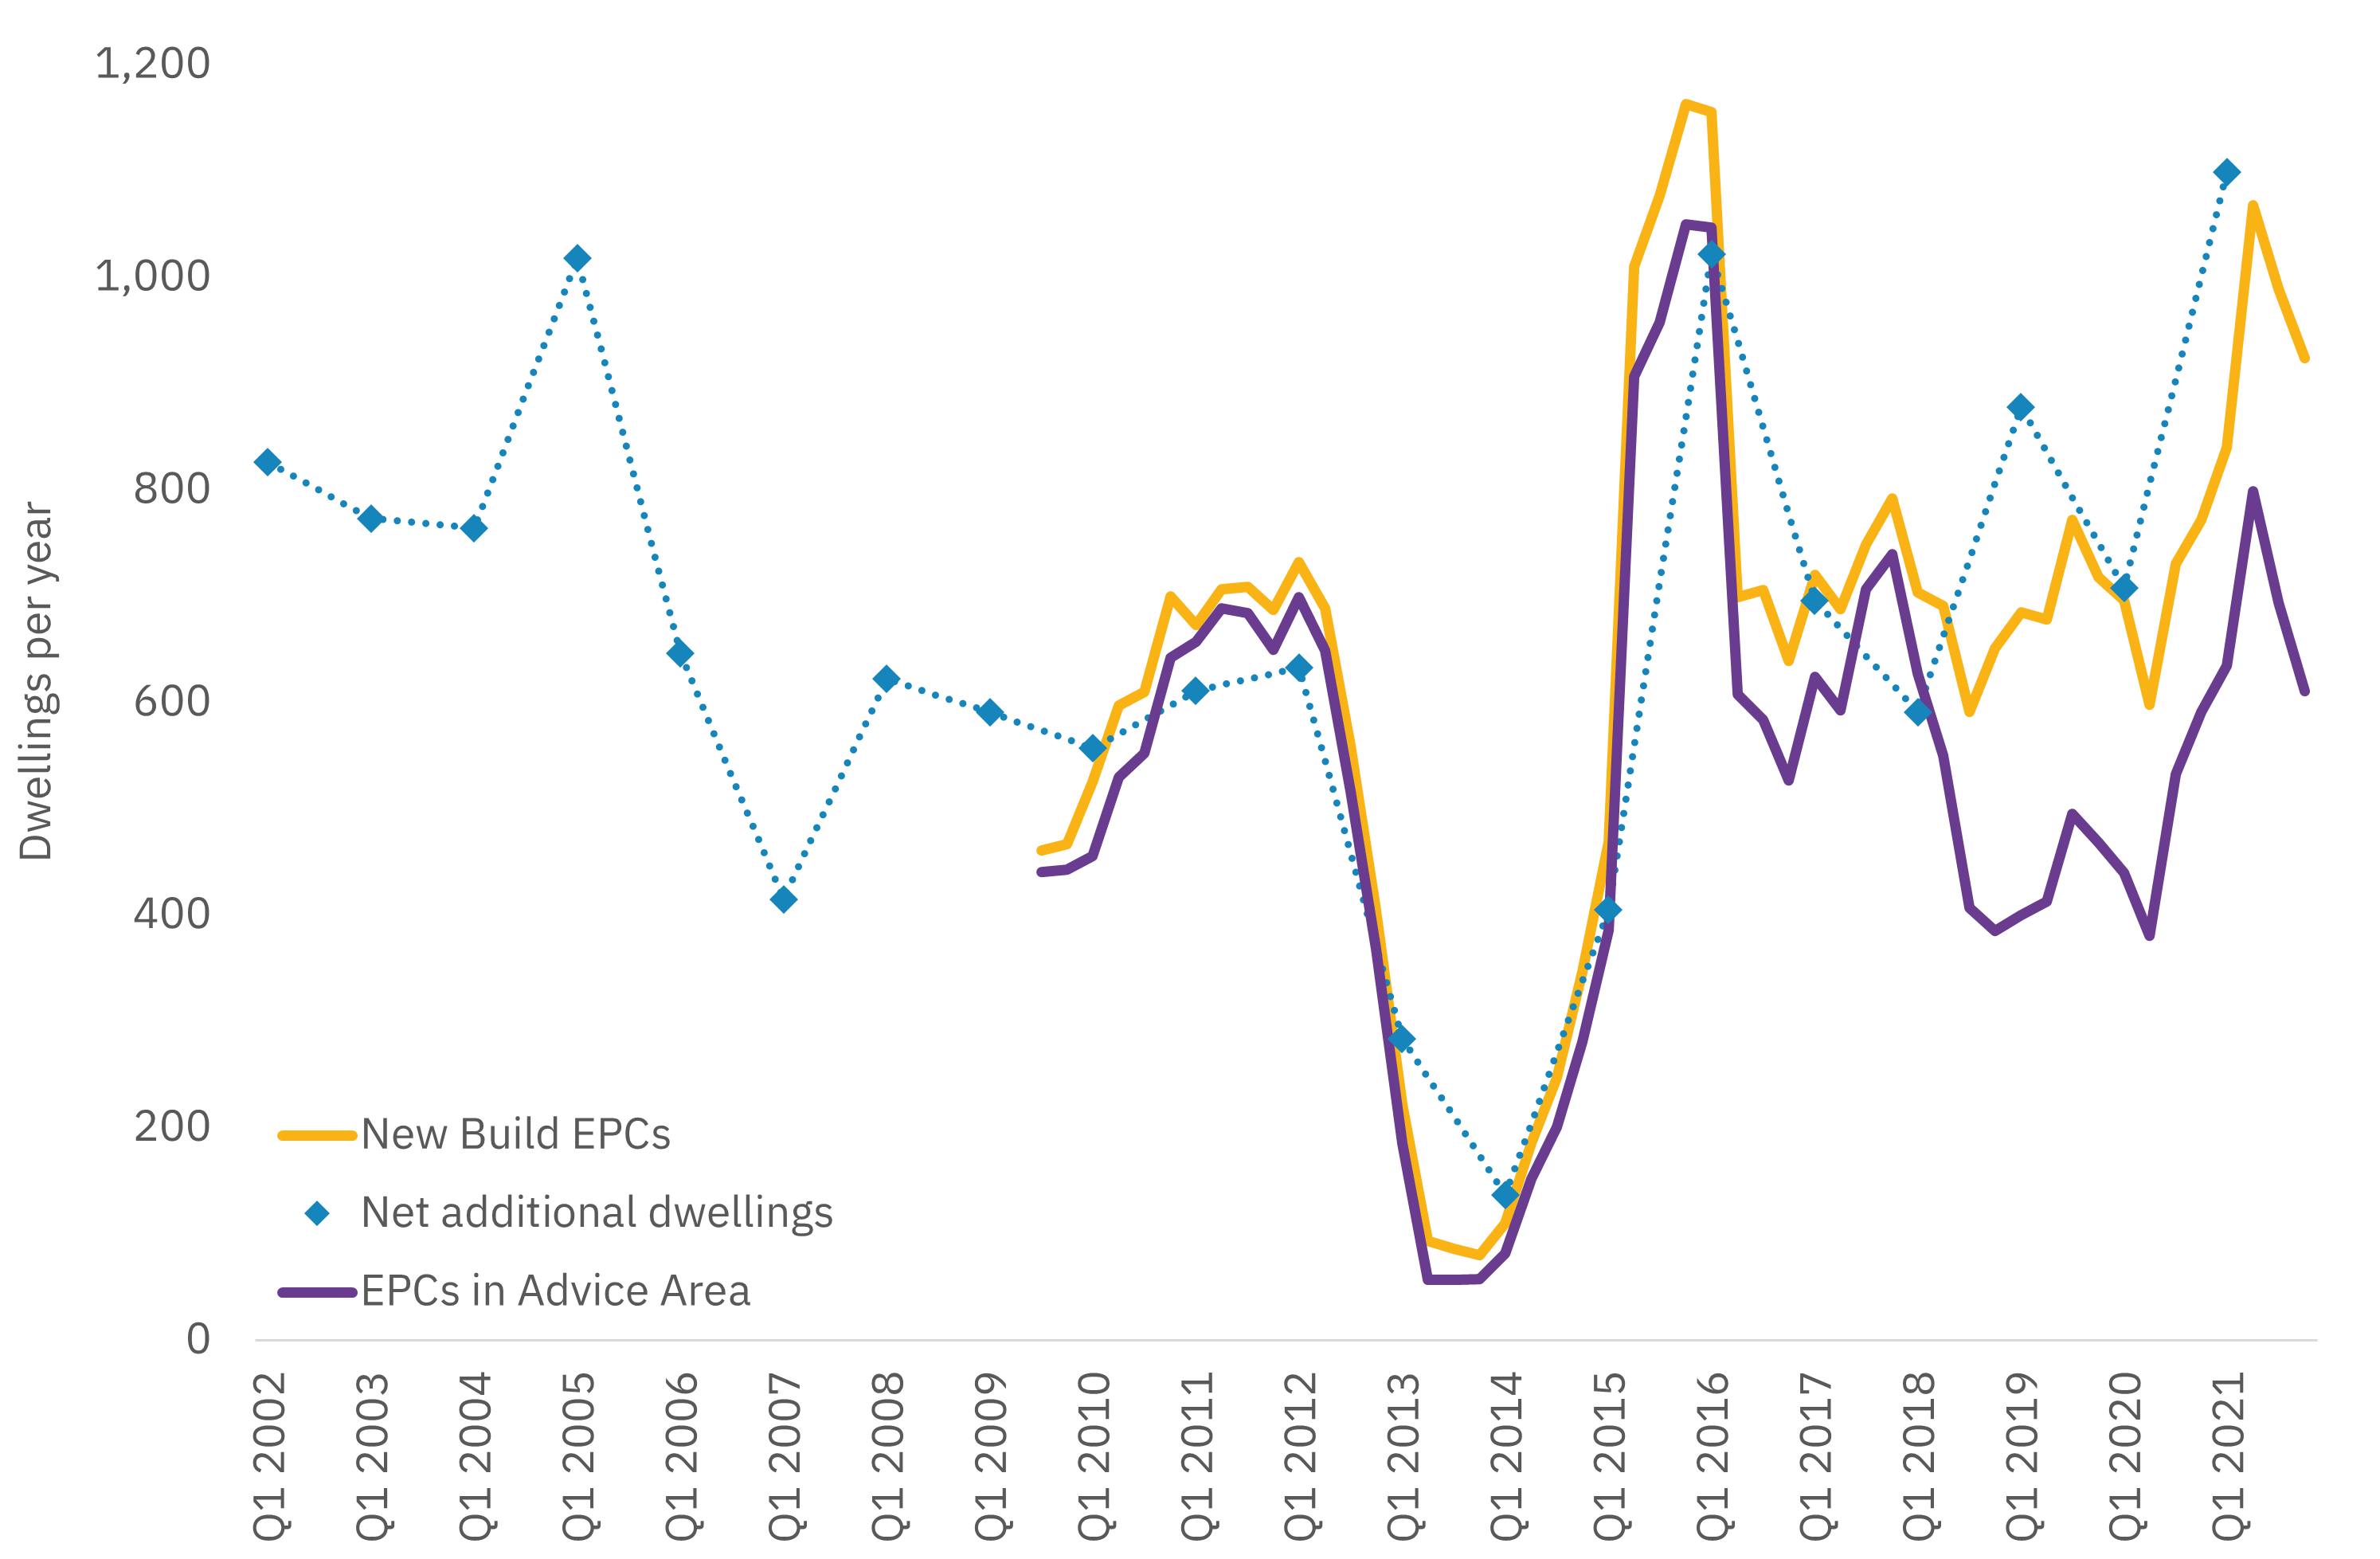
The chart below (fig 11) shows an example for Ashford local authority.
It is worth noting that there are some small differences between the number of EPCs in the quarterly summary data published by DLUHC and the individual records used here. This chart is based wholly on the individual records.
The chart firstly shows the relationship between total EPCs (yellow line) and the DLUHC net additional dwellings data (blue line). The number of EPCs falling within the advice area is shown by the purple line.
Recent years have seen a lower proportion of homes delivered in the advice area.
- 2017: 93 per cent
- 2019: 65 per cent
- 2021: 66 per cent
| Date | New Build EPCs | Net additional dwellings | EPCs in Advice Area |
|---|---|---|---|
| Q1 2002 | 826 | ||
| Q2 2002 | |||
| Q3 2002 | |||
| Q4 2002 | |||
| Q1 2003 | 773 | ||
| Q2 2003 | |||
| Q3 2003 | |||
| Q4 2003 | |||
| Q1 2004 | 764 | ||
| Q2 2004 | |||
| Q3 2004 | |||
| Q4 2004 | |||
| Q1 2005 | 1,018 | ||
| Q2 2005 | |||
| Q3 2005 | |||
| Q4 2005 | |||
| Q1 2006 | 646 | ||
| Q2 2006 | |||
| Q3 2006 | |||
| Q4 2006 | |||
| Q1 2007 | 415 | ||
| Q2 2007 | |||
| Q3 2007 | |||
| Q4 2007 | |||
| Q1 2008 | 622 | ||
| Q2 2008 | |||
| Q3 2008 | |||
| Q4 2008 | |||
| Q1 2009 | 591 | ||
| Q2 2009 | |||
| Q3 2009 | 461 | 441 | |
| Q4 2009 | 467 | 443 | |
| Q1 2010 | 525 | 557 | 456 |
| Q2 2010 | 597 | 530 | |
| Q3 2010 | 610 | 552 | |
| Q4 2010 | 700 | 642 | |
| Q1 2011 | 673 | 611 | 657 |
| Q2 2011 | 707 | 689 | |
| Q3 2011 | 709 | 684 | |
| Q4 2011 | 687 | 650 | |
| Q1 2012 | 732 | 633 | 699 |
| Q2 2012 | 689 | 649 | |
| Q3 2012 | 559 | 516 | |
| Q4 2012 | 404 | 368 | |
| Q1 2013 | 222 | 284 | 185 |
| Q2 2013 | 94 | 57 | |
| Q3 2013 | 86 | 57 | |
| Q4 2013 | 80 | 58 | |
| Q1 2014 | 110 | 137 | 82 |
| Q2 2014 | 186 | 152 | |
| Q3 2014 | 247 | 201 | |
| Q4 2014 | 347 | 281 | |
| Q1 2015 | 469 | 405 | 386 |
| Q2 2015 | 1,010 | 907 | |
| Q3 2015 | 1,077 | 958 | |
| Q4 2015 | 1,163 | 1,050 | |
| Q1 2016 | 1,156 | 1,022 | 1,047 |
| Q2 2016 | 699 | 608 | |
| Q3 2016 | 706 | 584 | |
| Q4 2016 | 639 | 527 | |
| Q1 2017 | 720 | 696 | 624 |
| Q2 2017 | 688 | 593 | |
| Q3 2017 | 749 | 707 | |
| Q4 2017 | 792 | 740 | |
| Q1 2018 | 704 | 591 | 627 |
| Q2 2018 | 691 | 550 | |
| Q3 2018 | 591 | 407 | |
| Q4 2018 | 651 | 385 | |
| Q1 2019 | 685 | 878 | 400 |
| Q2 2019 | 678 | 413 | |
| Q3 2019 | 772 | 495 | |
| Q4 2019 | 718 | 468 | |
| Q1 2020 | 696 | 708 | 440 |
| Q2 2020 | 598 | 381 | |
| Q3 2020 | 731 | 533 | |
| Q4 2020 | 772 | 591 | |
| Q1 2021 | 840 | 1,099 | 635 |
| Q2 2021 | 1,068 | 799 | |
| Q3 2021 | 989 | 694 | |
| Q4 2021 | 924 | 6 |
Table: Relationship between EPCs – Ashford local authority (data for fig 11)
Local planning authority results
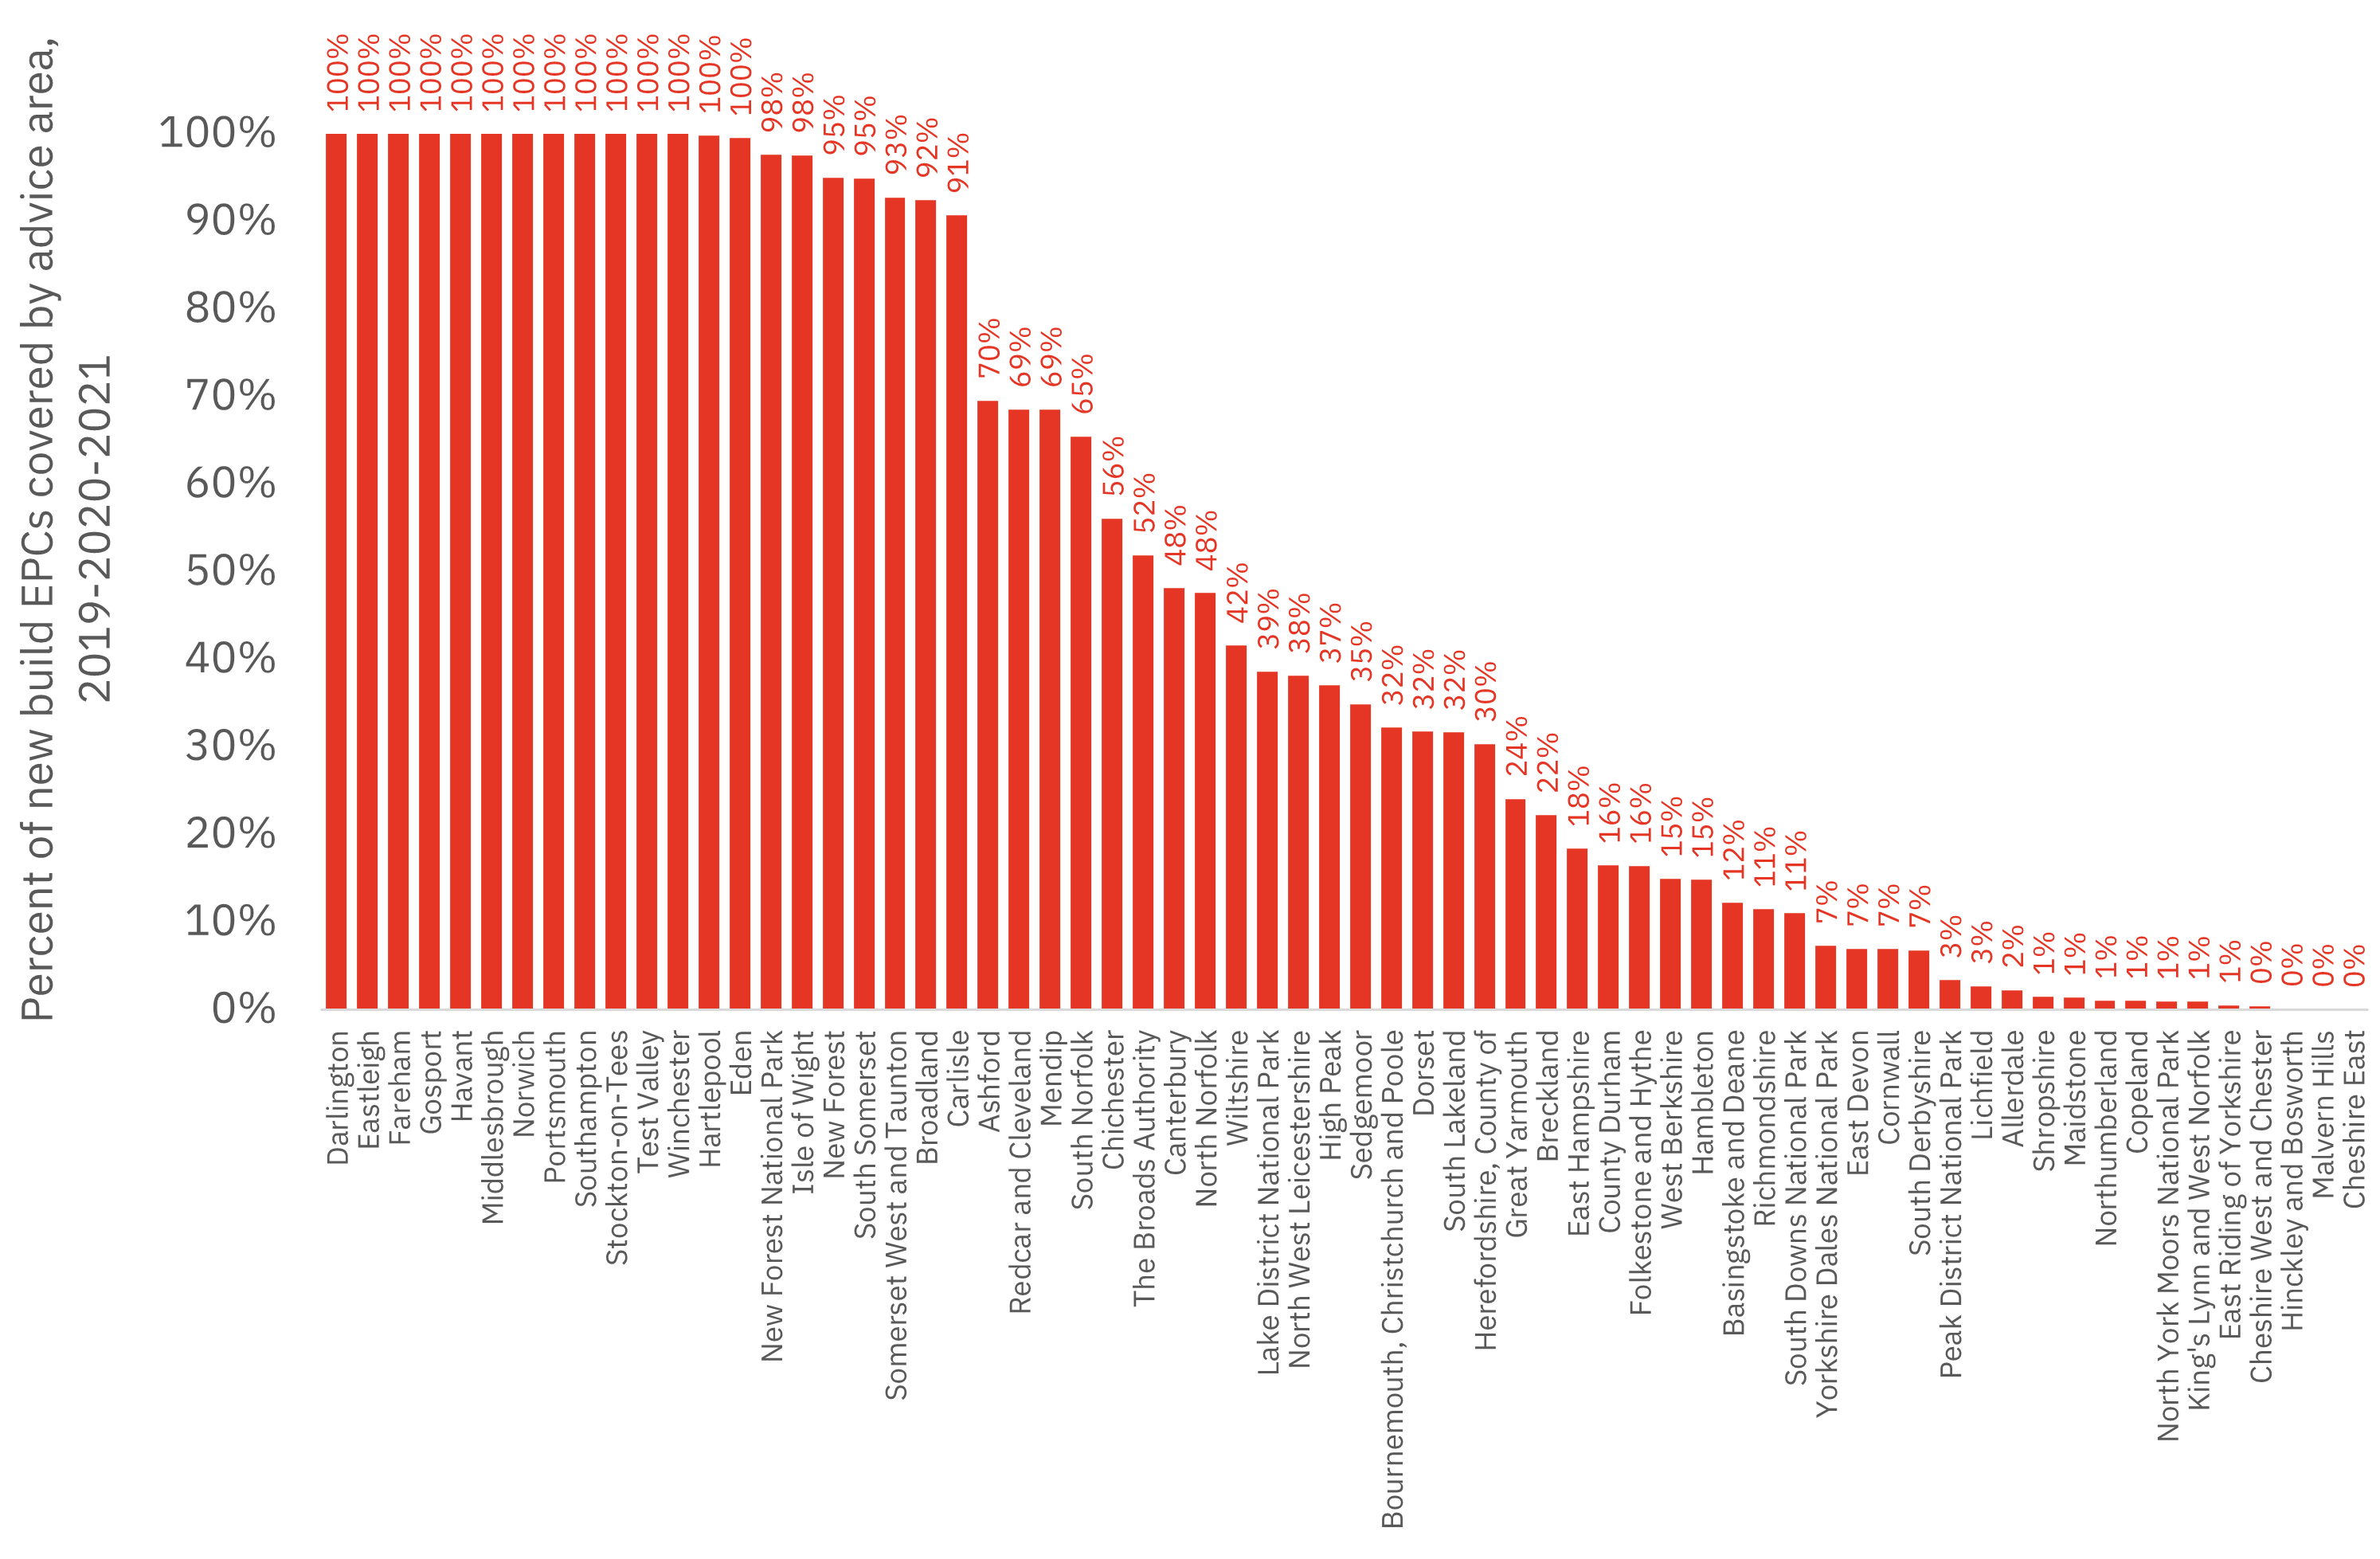
We have replicated the earlier local authority district analysis for local planning authorities (fig 12, below).
The results are shown opposite with 14 local planning authorities having an advice area covering 99 per cent or more of their recent housing delivery.
| Location | Per cent of new build EPCs covered by advice area |
|---|---|
| Darlington | 100% |
| Eastleigh | 100% |
| Fareham | 100% |
| Gosport | 100% |
| Havant | 100% |
| Middlesbrough | 100% |
| Norwich | 100% |
| Portsmouth | 100% |
| Southampton | 100% |
| Stockton-on-Tees | 100% |
| Test Valley | 100% |
| Winchester | 100% |
| Hartlepool | 100% |
| Eden | 100% |
| New Forest National Park | 98% |
| Isle of Wight | 98% |
| New Forest | 95% |
| South Somerset | 95% |
| Somerset West and Taunton | 93% |
| Broadland | 92% |
| Carlisle | 91% |
| Ashford | 70% |
| Redcar and Cleveland | 69% |
| Mendip | 69% |
| South Norfolk | 65% |
| Chichester | 56% |
| The Broads Authority | 52% |
| Canterbury | 48% |
| North Norfolk | 48% |
| Wiltshire | 42% |
| Lake District National Park | 39% |
| North West Leicestershire | 38% |
| High Peak | 37% |
| Sedgemoor | 35% |
| Bournemouth, Christchurch and Poole | 32% |
| Dorset | 32% |
| South Lakeland | 32% |
| Herefordshire, County of | 30% |
| Great Yarmouth | 24% |
| Breckland | 22% |
| East Hampshire | 18% |
| County Durham | 16% |
| Folkestone and Hythe | 16% |
| West Berkshire | 15% |
| Hambleton | 15% |
| Basingstoke and Deane | 12% |
| Richmondshire | 11% |
| South Downs National Park | 11% |
| Yorkshire Dales National Park | 7% |
| East Devon | 7% |
| Cornwall | 7% |
| South Derbyshire | 7% |
| Peak District National Park | 3% |
| Lichfield | 3% |
| Allerdale | 2% |
| Shropshire | 1% |
| Maidstone | 1% |
| Northumberland | 1% |
| Copeland | 1% |
| North York Moors National Park | 1% |
| King's Lynn and West Norfolk | 1% |
| East Riding of Yorkshire | 1% |
| Cheshire West and Chester | 0% |
| Hinckley and Bosworth | 0% |
| Malvern Hills | 0% |
| Cheshire East | 0% |
Table: Per cent of new build EPCs covered by advice area – local planning authority (data for fig 12)
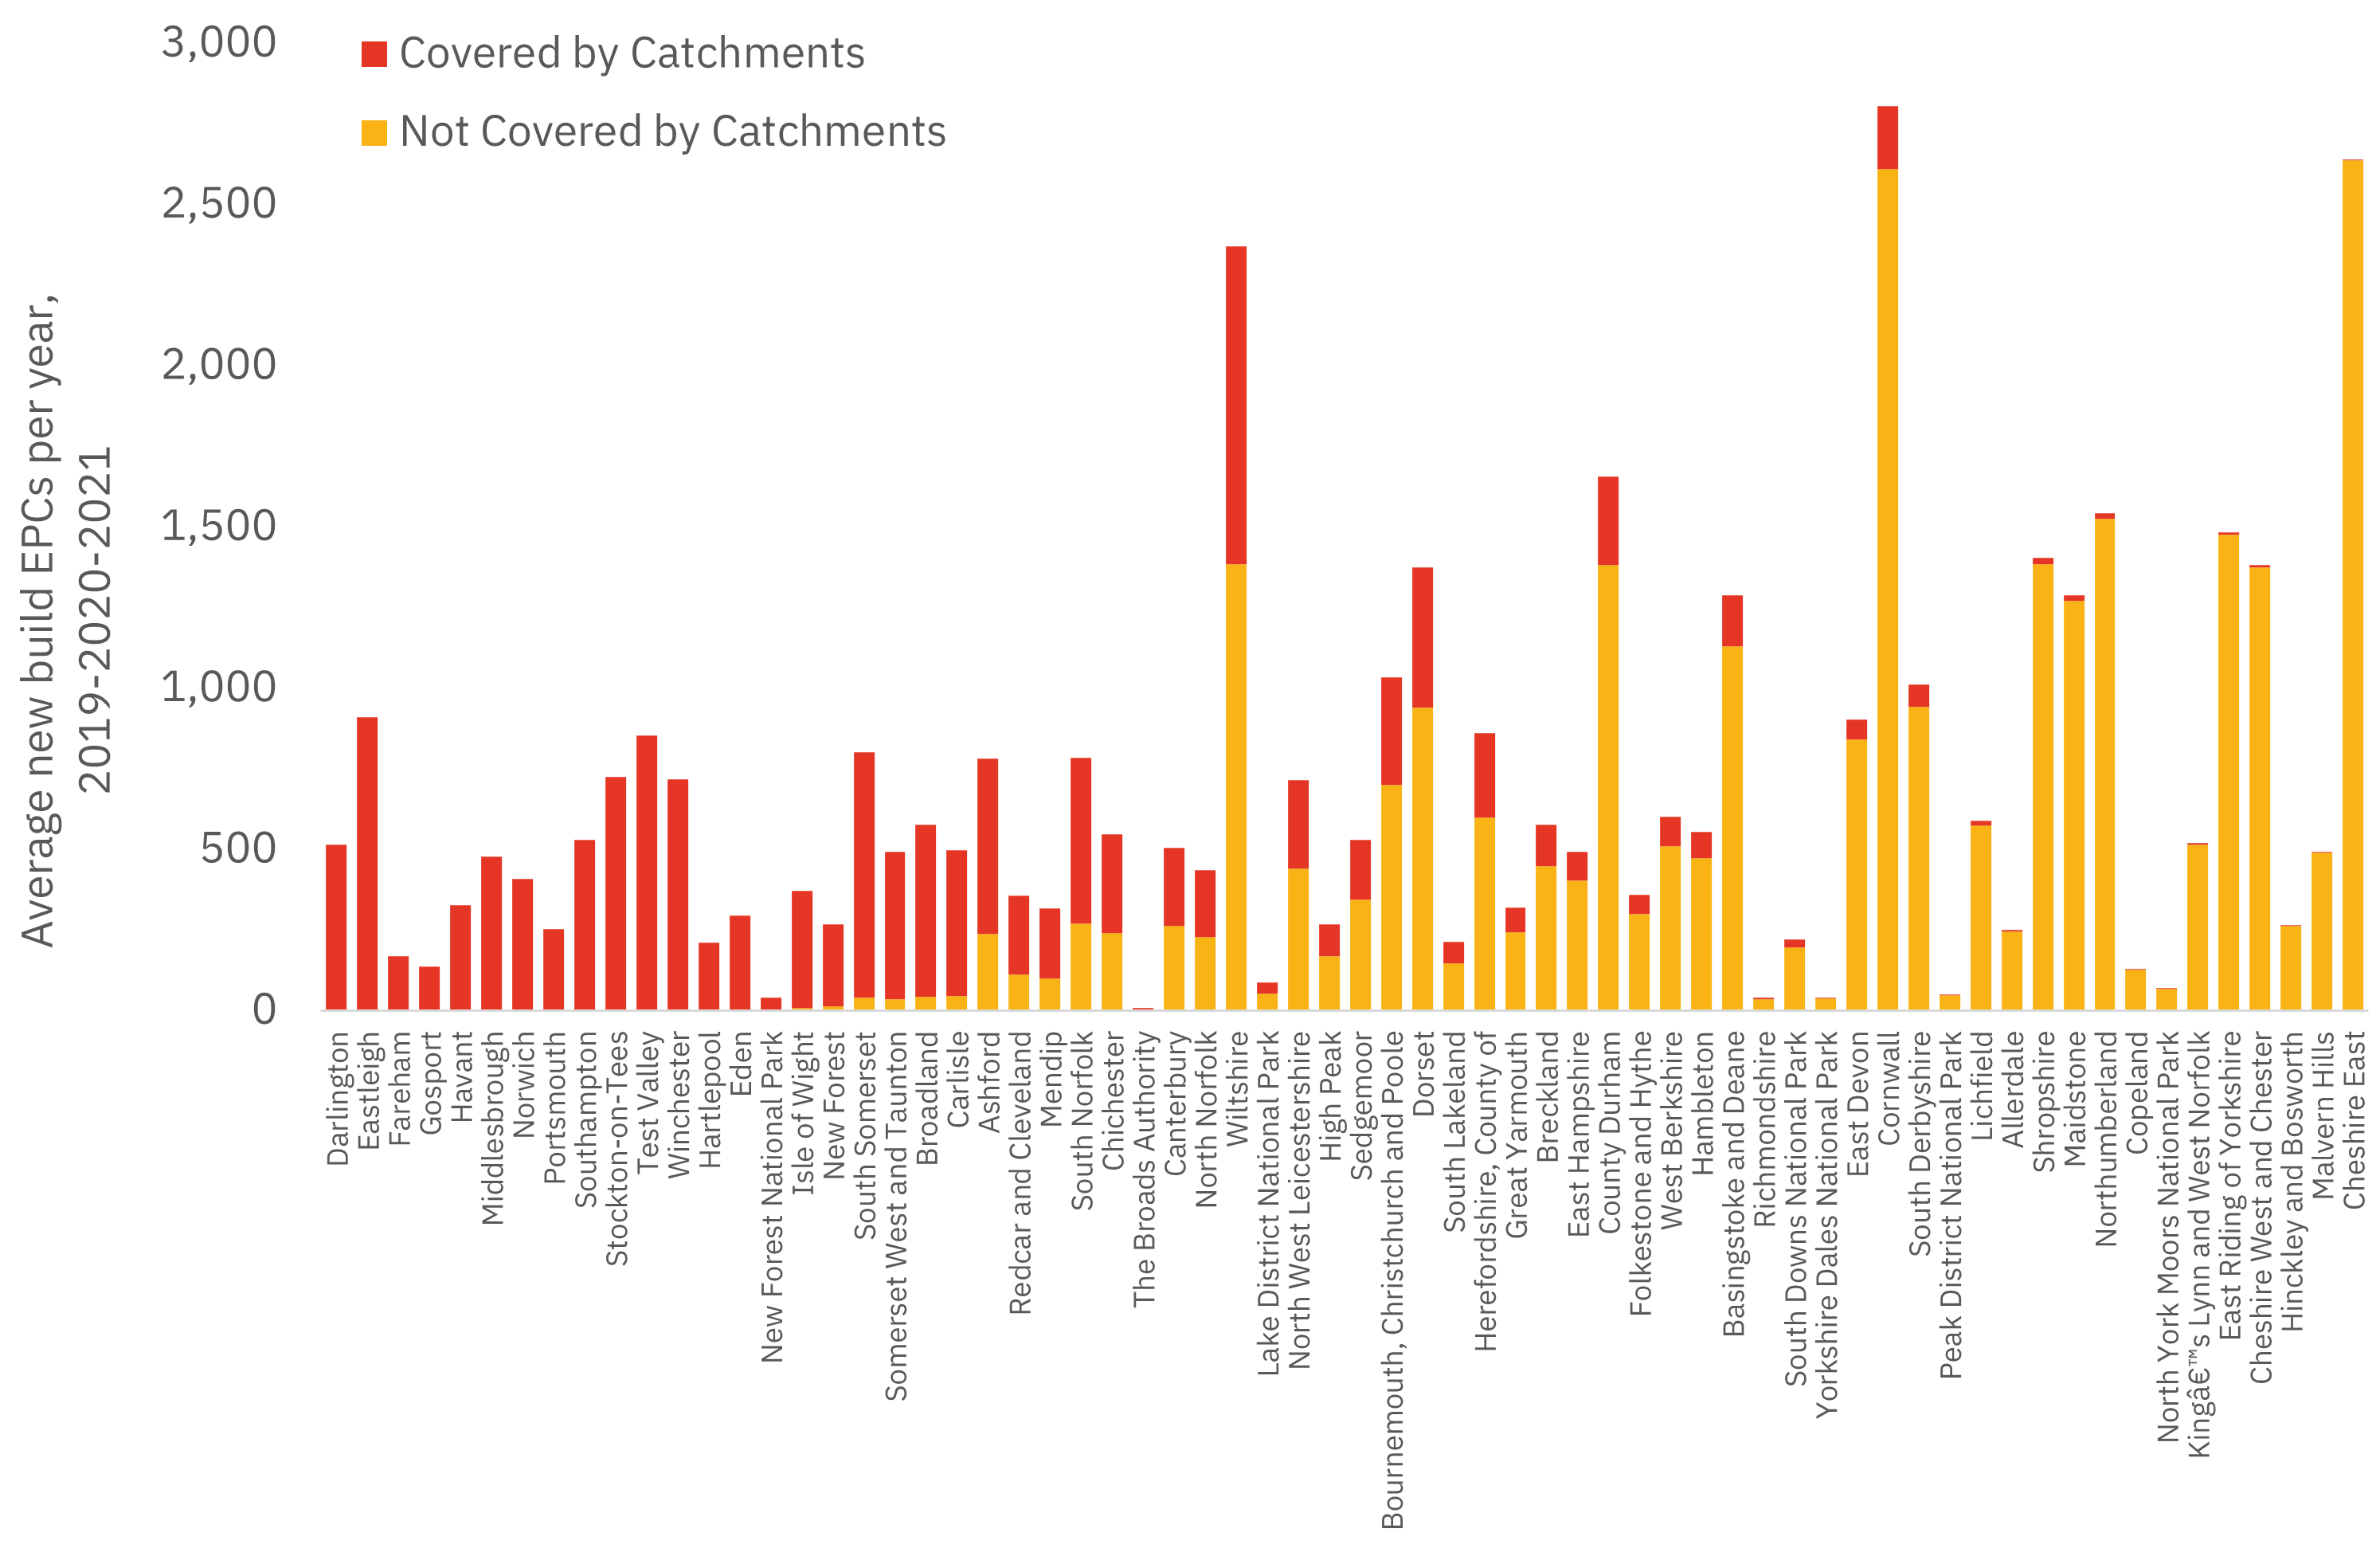
This chart below (fig 13) shows the underlying data used to calculate the percentage data shown above.
| Location | Not covered by catchments | Covered by catchments |
|---|---|---|
| Darlington | 0 | 515 |
| Eastleigh | 0 | 910 |
| Fareham | 0 | 169 |
| Gosport | 0 | 137 |
| Havant | 0 | 328 |
| Middlesbrough | 0 | 478 |
| Norwich | 0 | 409 |
| Portsmouth | 0 | 253 |
| Southampton | 0 | 529 |
| Stockton-on-Tees | 0 | 725 |
| Test Valley | 0 | 854 |
| Winchester | 0 | 717 |
| Hartlepool | 0 | 212 |
| Eden | 1 | 293 |
| New Forest National Park | 1 | 41 |
| Isle of Wight | 9 | 362 |
| New Forest | 13 | 254 |
| South Somerset | 41 | 760 |
| Somerset West and Taunton | 36 | 457 |
| Broadland | 44 | 533 |
| Carlisle | 46 | 451 |
| Ashford | 238 | 543 |
| Redcar and Cleveland | 113 | 245 |
| Mendip | 100 | 217 |
| South Norfolk | 271 | 514 |
| Chichester | 241 | 307 |
| The Broads Authority | 4 | 5 |
| Canterbury | 262 | 244 |
| North Norfolk | 229 | 208 |
| Wiltshire | 1,384 | 987 |
| Lake District National Park | 54 | 34 |
| North West Leicestershire | 442 | 273 |
| High Peak | 168 | 99 |
| Sedgemoor | 345 | 185 |
| Bournemouth, Christchurch and Poole | 701 | 333 |
| Dorset | 939 | 437 |
| South Lakeland | 146 | 68 |
| Herefordshire, County of | 600 | 261 |
| Great Yarmouth | 244 | 77 |
| Breckland | 450 | 128 |
| East Hampshire | 403 | 91 |
| County Durham | 1,383 | 273 |
| Folkestone and Hythe | 300 | 59 |
| West Berkshire | 511 | 90 |
| Hambleton | 472 | 82 |
| Basingstoke and Deane | 1,131 | 158 |
| Richmondshire | 36 | 5 |
| South Downs National Park | 197 | 24 |
| Yorkshire Dales National Park | 38 | 3 |
| East Devon | 841 | 63 |
| Cornwall | 2,611 | 195 |
| South Derbyshire | 942 | 69 |
| Peak District National Park | 48 | 2 |
| Lichfield | 574 | 16 |
| Allerdale | 246 | 6 |
| Shropshire | 1,384 | 21 |
| Maidstone | 1,271 | 18 |
| Northumberland | 1,526 | 16 |
| Copeland | 128 | 1 |
| North York Moors National Park | 68 | 1 |
| King's Lynn and West Norfolk | 514 | 5 |
| East Riding of Yorkshire | 1,477 | 8 |
| Cheshire West and Chester | 1,376 | 6 |
| Hinckley and Bosworth | 262 | 0 |
| Malvern Hills | 490 | 0 |
| Cheshire East | 2,637 | 1 |
Table: Average new build EPCs per year – local planning authority (data for fig 13)
Further considerations: Water neutrality
A further consideration is areas impacted by water neutrality. The Sussex North water zone has a ban on new development unless water can be supplied without damaging the ecosystem.
The water zone covers Horsham, Crawley, Mid Sussex, and Chichester. There is a spatial overlap with the Solent nutrient neutrality area but no homes have been delivered in this area.
The water zone covers 99.8 per cent of Horsham’s recent housing delivery, 94.3 per cent of Crawley’s, 10.2 per cent of Mid Sussex, and 9.1 per cent of Chichester’s.
It adds a further 3,900 homes per year.
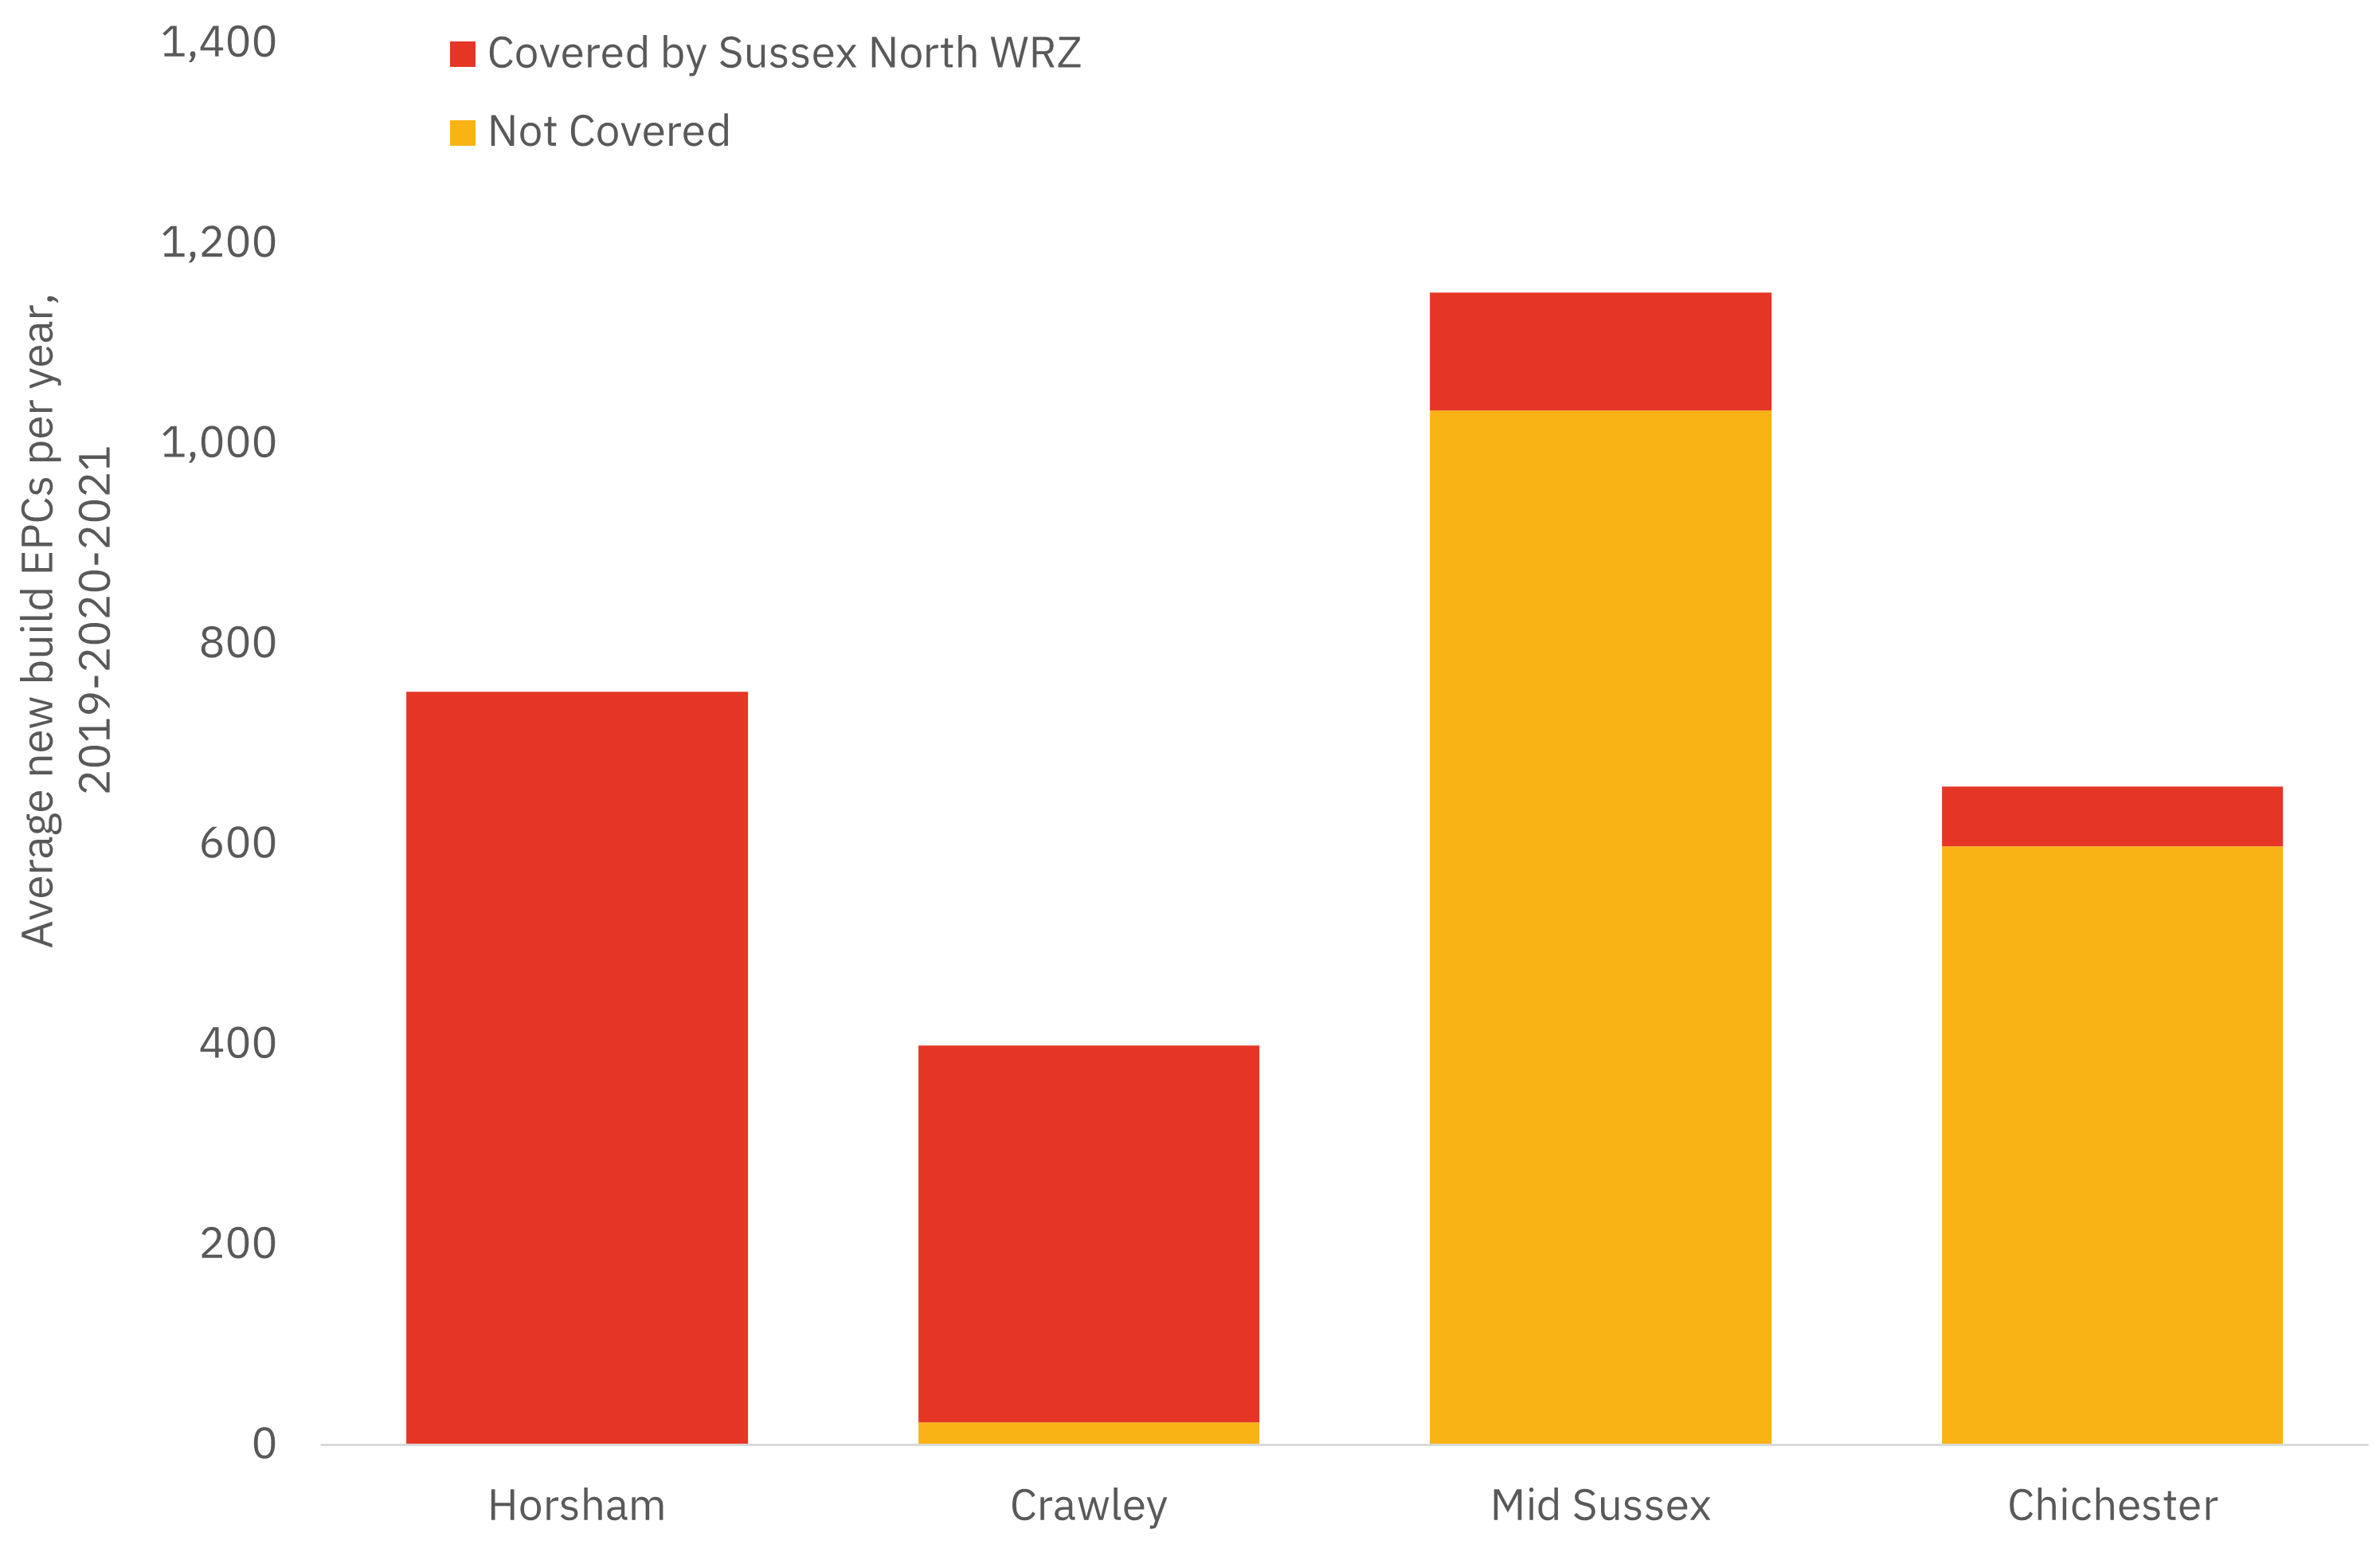
| Location | Not covered | Covered by Sussex North WRZ |
|---|---|---|
| Horsham | 1 | 751 |
| Crawley | 23 | 376 |
| Mid Sussex | 1,034 | 117 |
| Chichester | 599 | 60 |
Table: Average new build EPCs per year – Sussex North water zone (data for fig 14)
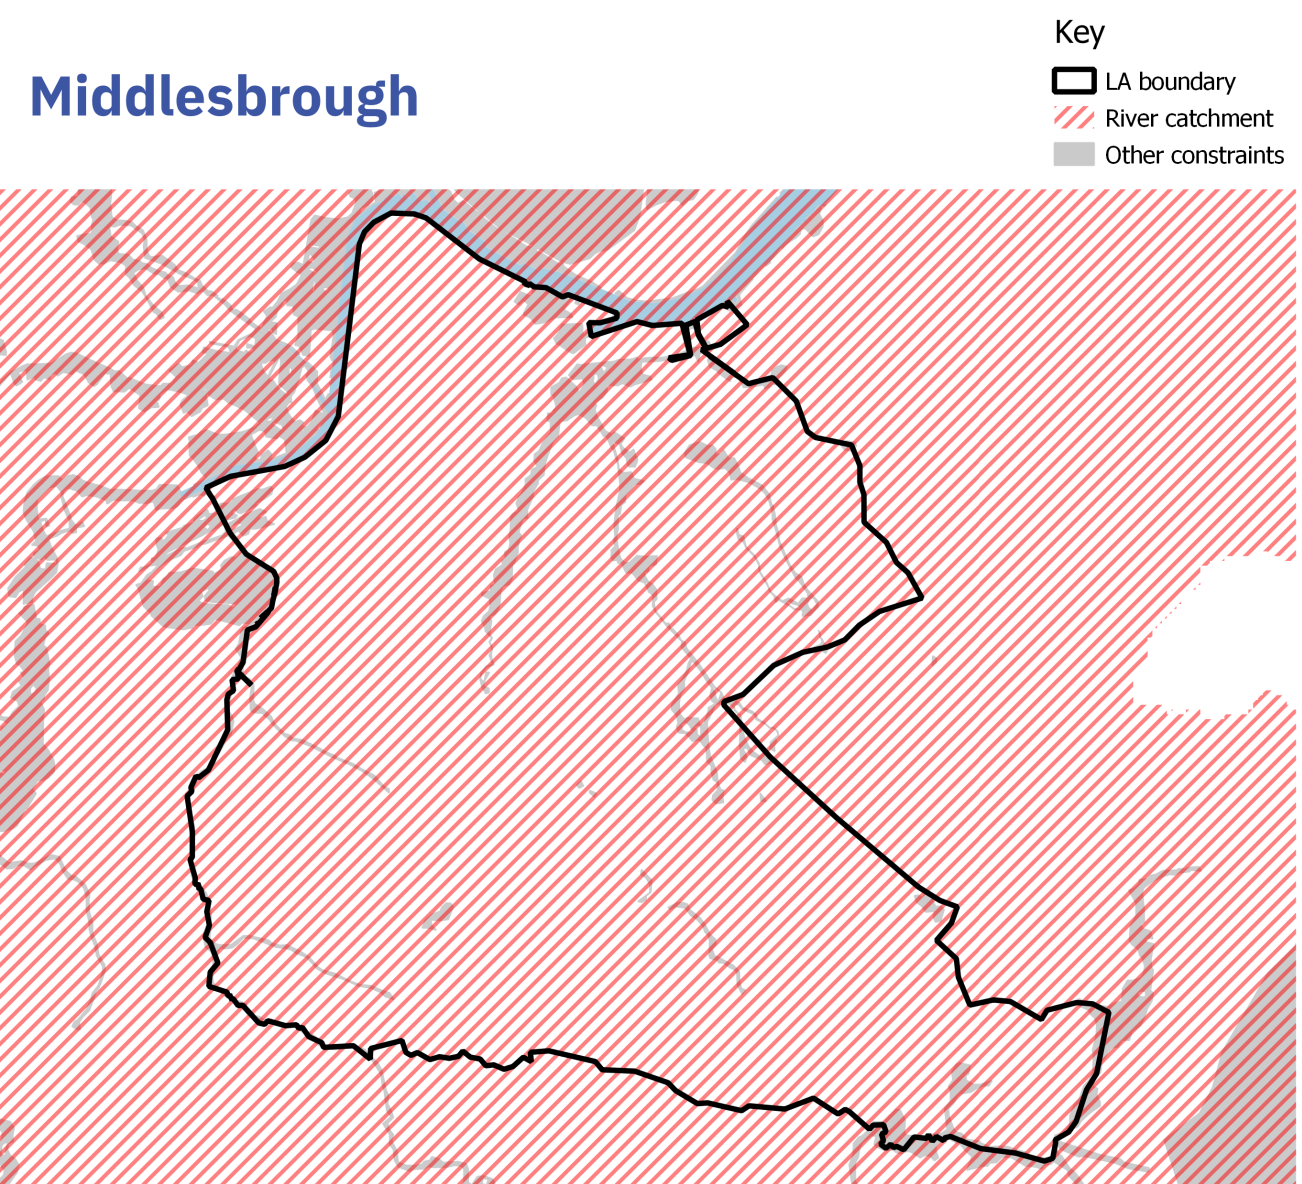
Example land cover maps
This section includes mapped examples of local authority areas affected by the new guidance in different ways.
- Category 1: Minimal existing environmental constraints, significant impact from river catchments (e.g. Fareham, Middlesbrough, Broadland).
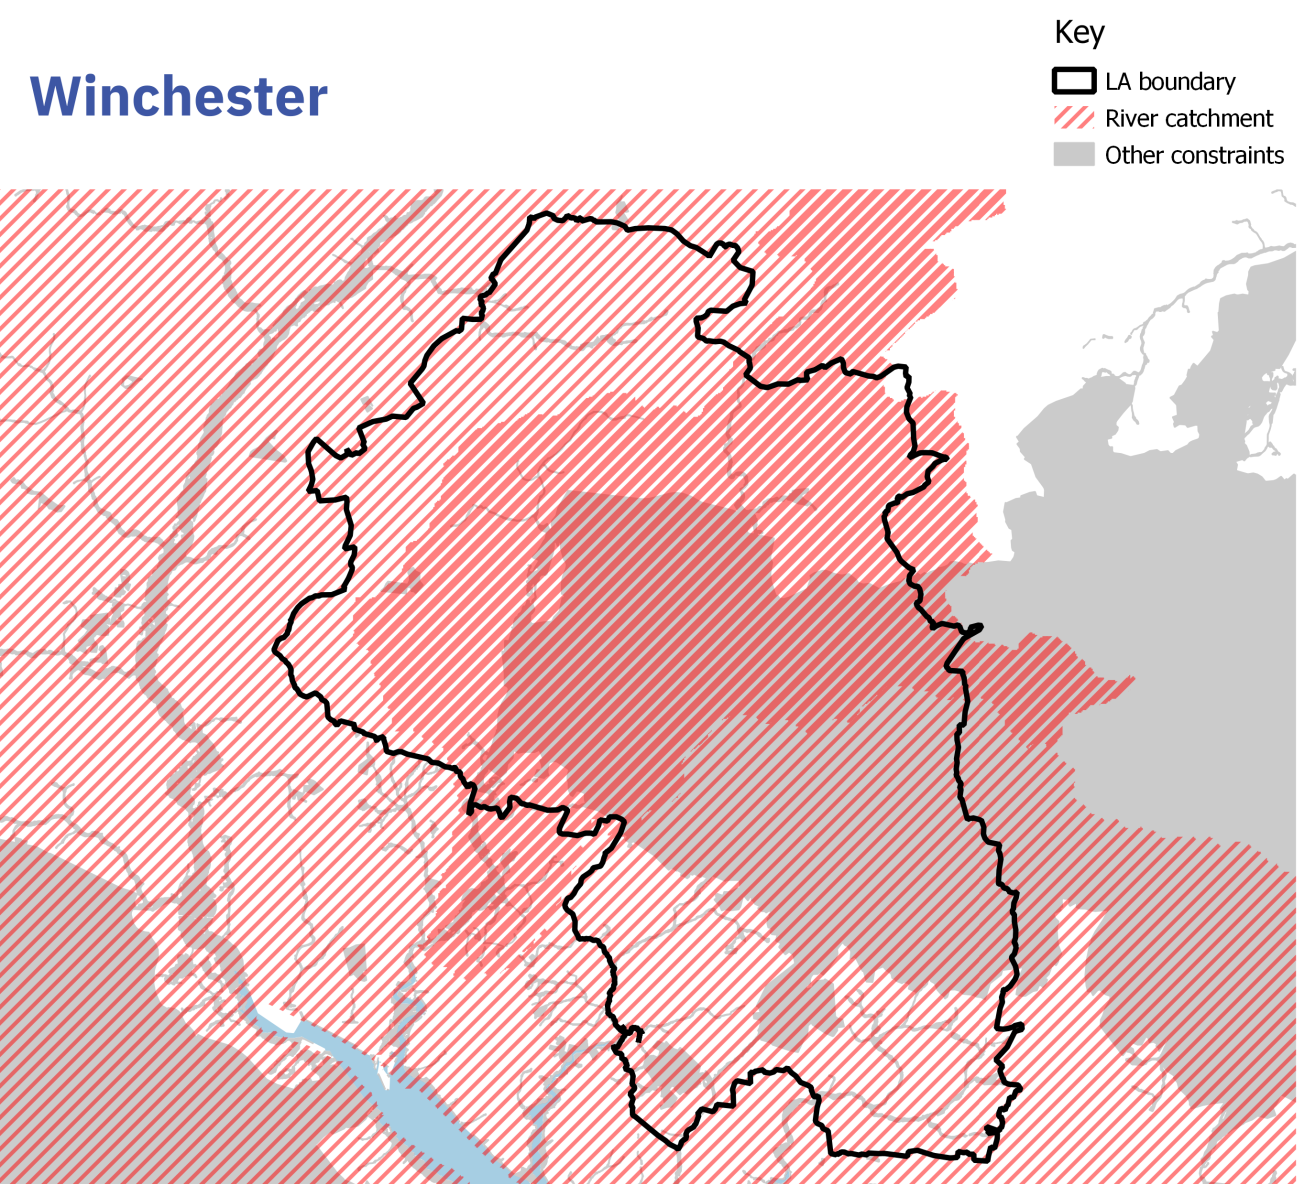
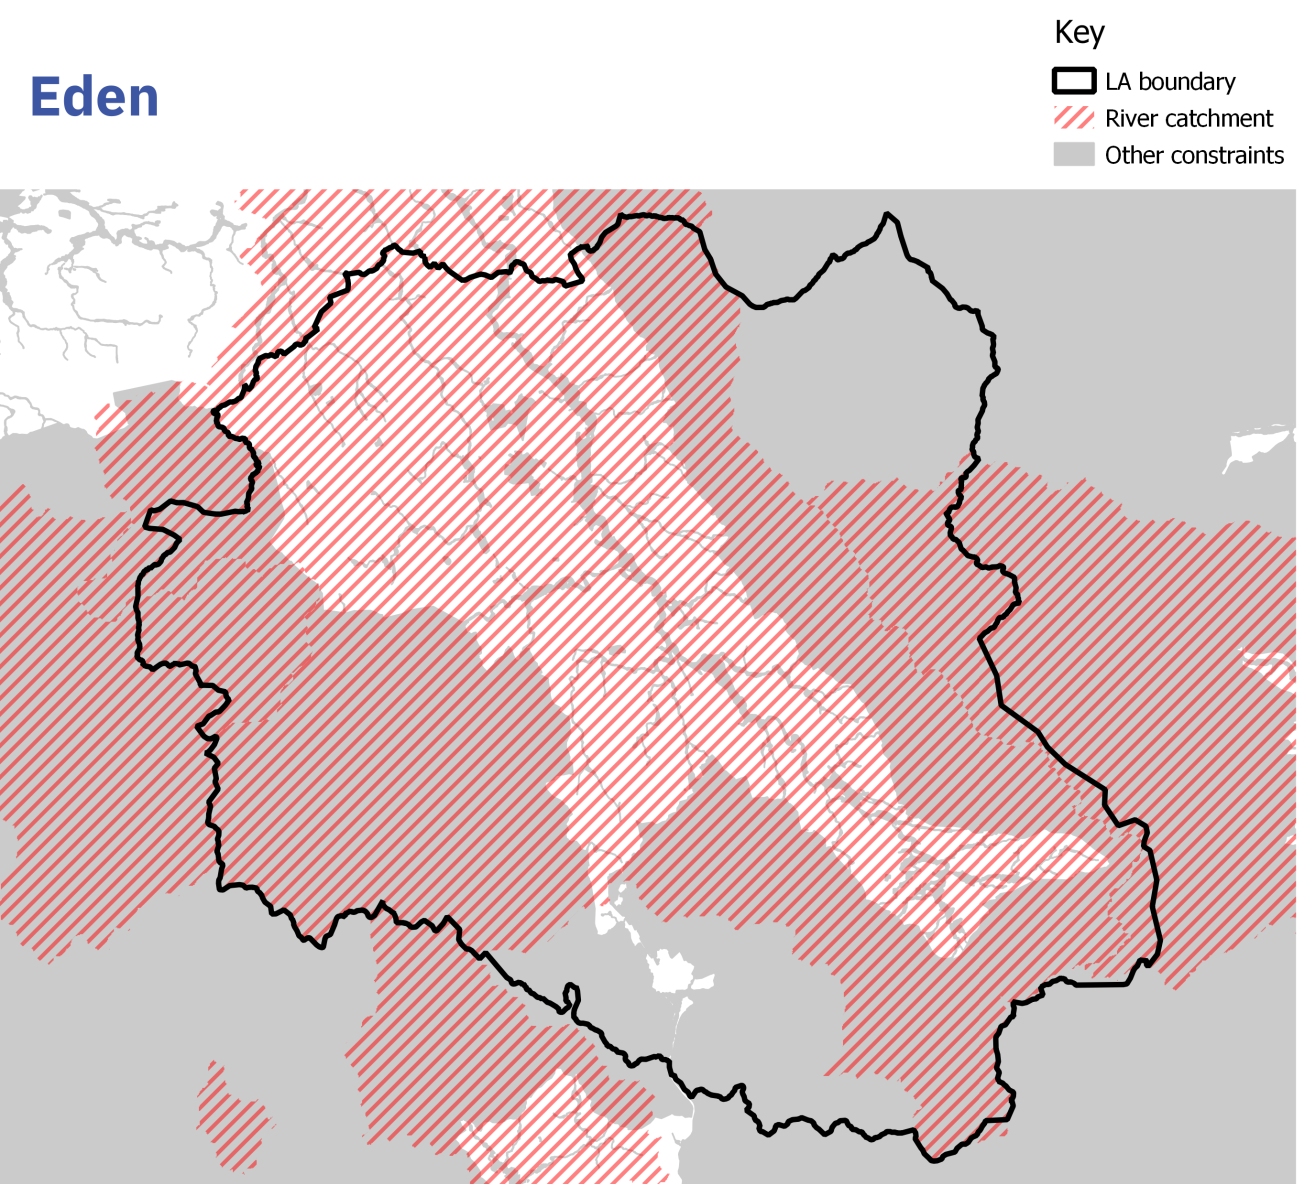
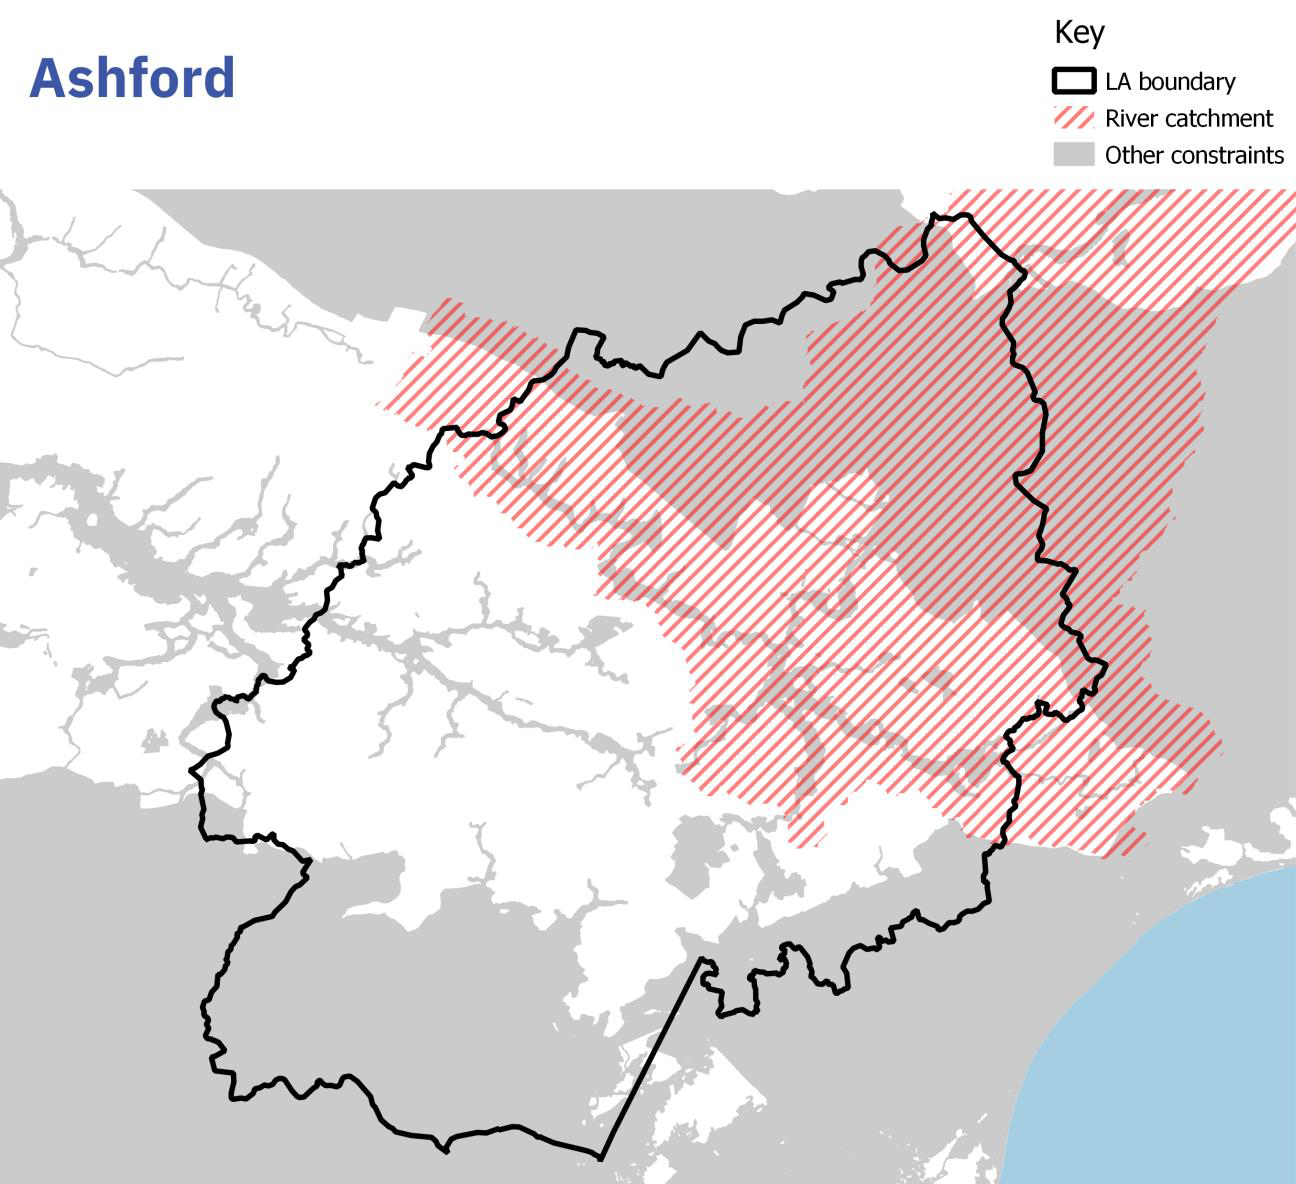
- Category 2: Some existing environmental constraints, significant impact from river catchments (e.g. Winchester, Ashford, Eden).
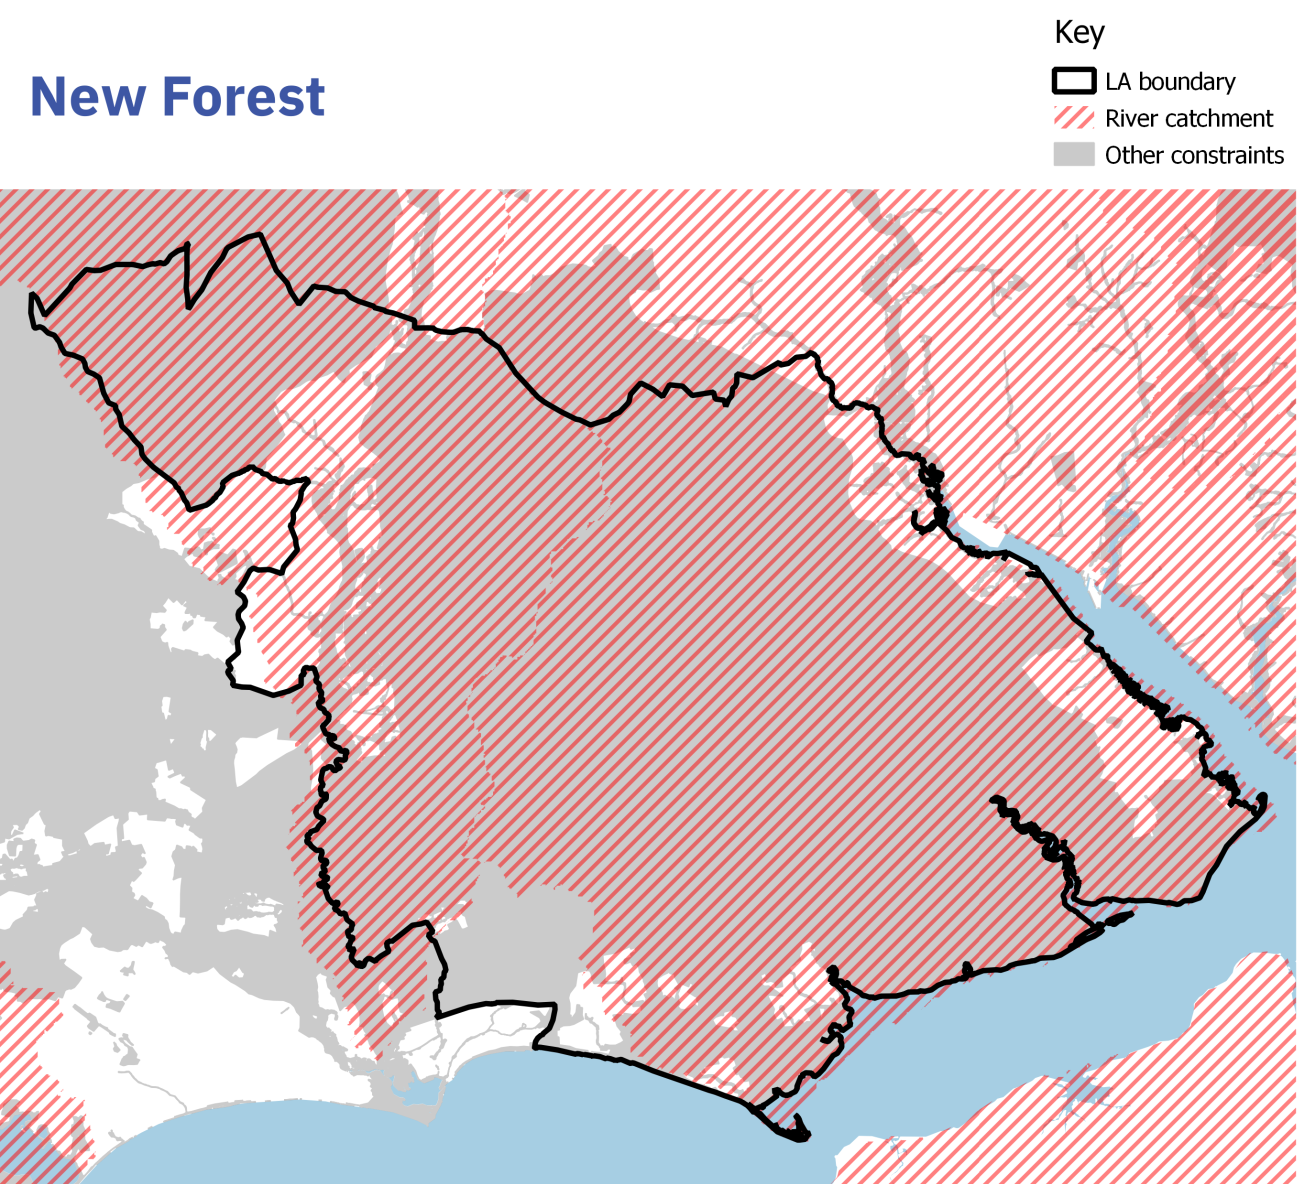
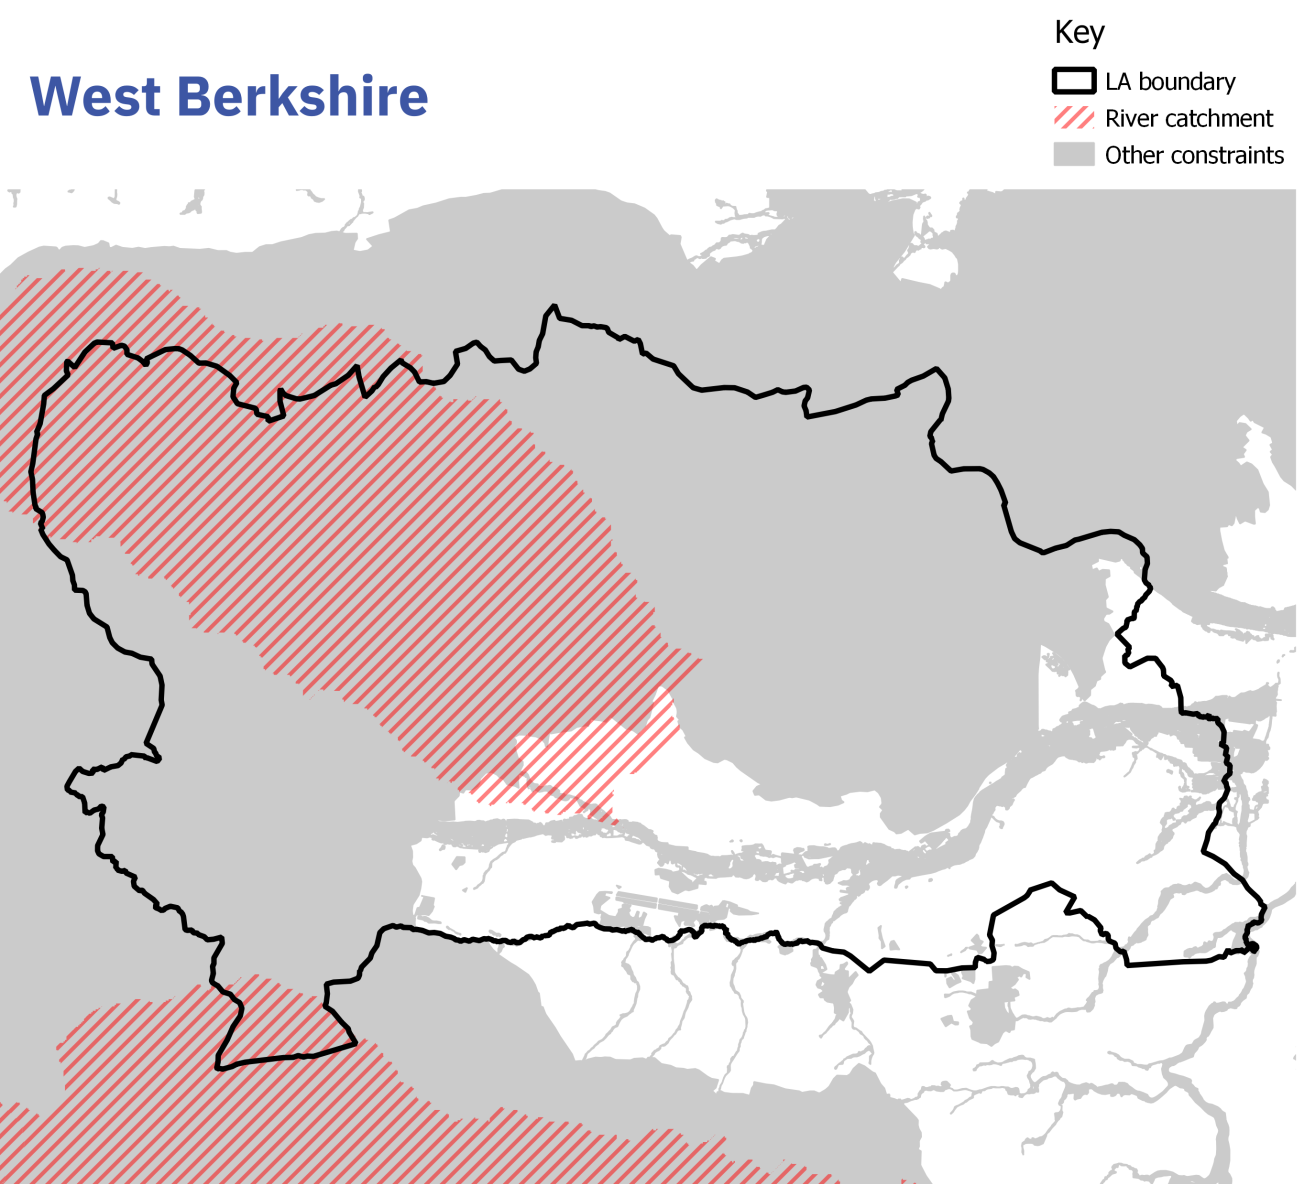
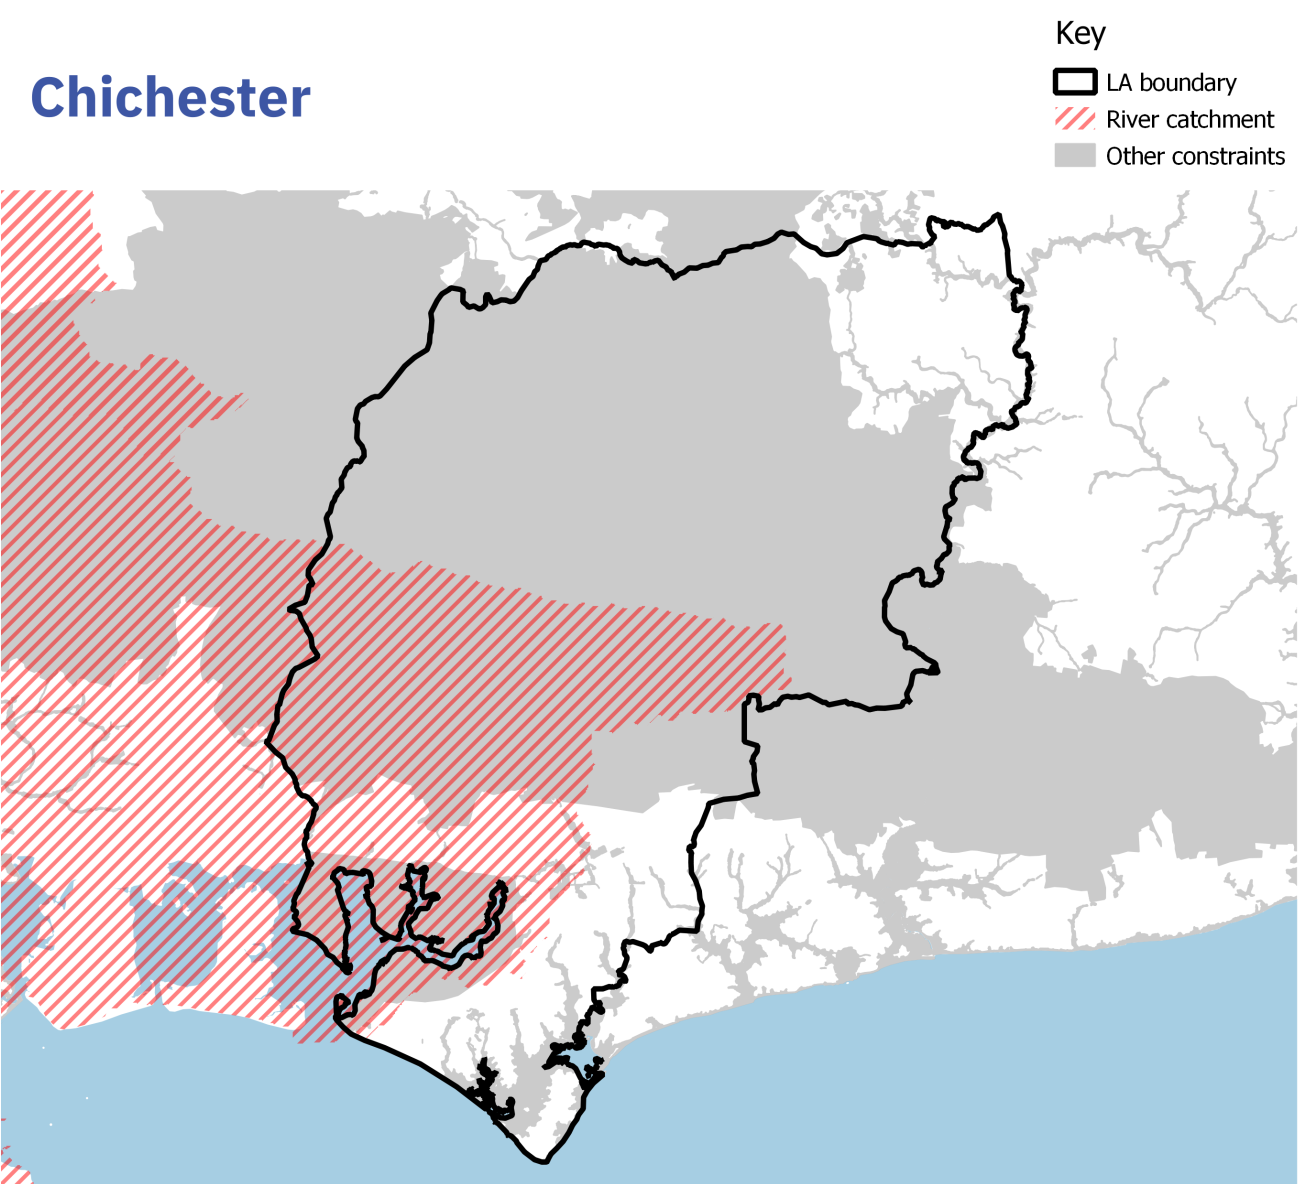
- Category 3: Significant existing environmental constraints, overlapping with impact from river catchments (e.g. New Forest, West Berkshire, Chichester).
Land cover maps: category 1
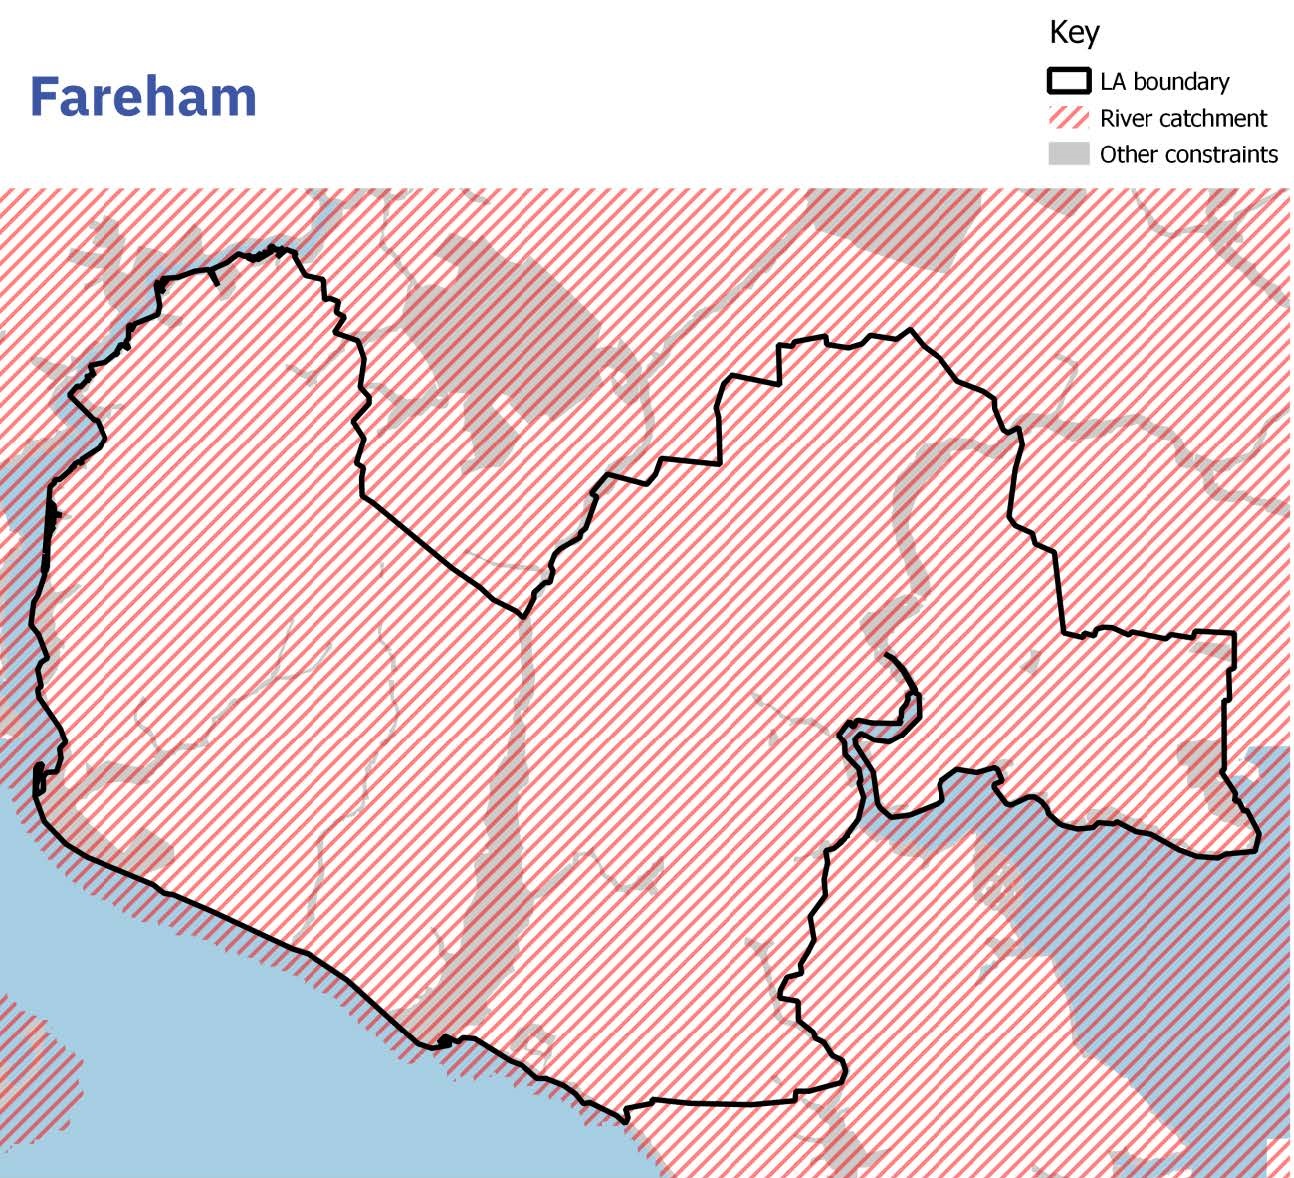
Fareham is already covered by the Solent catchment with 100 per cent of its recent housing delivery falling within it.
It is also covered by a Habitats Regulations recreational disturbance mitigation strategy – specifically for overwintering birds.
Planning permission for proposals resulting in a net increase in residential units may be permitted where ‘in-combination’ effects of recreation on the Special Protection Areas are demonstrated to be satisfactorily mitigated through the provision of a financial contribution towards the Solent Recreation Mitigation Strategy.

Land cover maps: category 2
Land cover maps: category 3