From June 2021 – August 2021, the City of Westminster undertook a behavioural insights trial to test ways of reducing the dumping of waste bags and bulky items. Two new bin designs were tested. One design used, “biophilia”, which involves exposing people to images of nature to prime them to be more pro social. The other added “affect” to the bins by using playfully designed characters. “Affect” is the behavioural principle of adding positive emotion to make correct disposal more engaging. A randomised control trial was conducted to assess the efficacy of these interventions.
Introduction
From June 2021 – August 2021, the City of Westminster and Ogilvy Consulting’s Behavioural Science Practice collaborated on a behavioural insights trial to test ways of reducing the dumping of waste bags and bulky items. Two new bin designs were tested. One design used, “biophilia”, which involves exposing people to images of nature to prime them to be more pro social. The other added “affect” to the bins by using playfully designed characters. “Affect” is the behavioural principle of adding positive emotion to make correct disposal more engaging. A randomised control trial was conducted to assess the efficacy of these interventions.
It was found that “Biophilia” bins were not effective and instead slightly increased waste on the street. While “Affect” bins did reduce waste on the street but not enough to be statistically significant.
The challenge
Across the City of Westminster, 90 per cent of residents know where and how to dispose of their waste, and 64 per cent are aware of Westminster’ Bulky Waste service. However, despite this there appears to be many instances where waste is disposed of by dumping on the street, making neighbourhoods unsightly. Furthermore, most (82 per cent) of dumped black bag incidents occurred at sites where there was space in the bins to place the waste.
So, to encourage City of Westminster residents to dispose of their waste correctly, we were tasked to design interventions that:
- Reduce the dumping of waste bags
- Reduce the dumping of bulky items
- Improve attitudes and perceptions of waste collection and the streetscape
In order to do this, we would need to create innovative and practical solutions embedded with Behavioural Science, specifically designed to overcome the behavioural and psychological barriers which currently prevent residents from disposing of their waste correctly.
The process
To effectively identify the behavioural barriers and drivers that lead to dumping behaviours, the team conducted a mixture of primary research and secondary (desk) research. This included observing and/or analysing: 10 bin sites in Westminster, nine WCC Research reports around waste disposal behaviour, current bin site use, and residents’ waste attitudes and beliefs.
This primary and secondary research covered topics such as: attitudes toward and beliefs to disposing waste in Westminster; current on-site communications and signage; current designs of bins; current environments around the bins; on street waste dumping, fly-tipping, and contamination.
From this research it was found that while current signage was generally designed well, they were subject to much wear and tear. This degradation in the signage integrity over time likely made them less effective.
Additionally, 13 of the most relevant behavioural science principles and studies around the drivers and barriers of waste, fly-tipping and recycling were analysed as part of our Behavioural Insights Review. This review of the academic literature allowed us to uncover further insights into what motivates – or discourages – correct waste disposal behaviour.
The 13 key psychological and behavioural principles that we identified are detailed below and categorised as either behavioural barriers (hindering good behaviour) or a driver (encouraging good behaviour).
Based on the behavioural science principles identified, we held an internal ideation workshop with Ogilvy creatives. From this we created a long list of possible interventions, which were then refined into 15 possible executions. These executions were presented to Westminster stakeholders as part of an idea selection and refinement workshop. Based on feasibility (cost, technical requirements) and forecasted impact, we agreed on two final routes to progress. Working with Westminster design teams, we then developed the assets for roll out.
Affordance cues
Barrier/Driver
Visual cues from the environment signal how the bins are supposed to be used.
Descriptive norms
Barrier
Using the good waste disposal behaviour of others to influence the misbehaving minority.
Cialdini, R. B., Kallgren, C. A., & Reno, R. R. (1990). A theoretical refinement and re-evaluation of the role of norms in human behaviors. Journal of Personality and Social Psychology, 58, 1015-1026.
Broken windows theory
Barrier
When people see the rubbish on the street being left unattended, their motivation to maintain the cleanliness of their street is diminished.
(Conceptions of space and crime in the punitive neoliberal city)
Affect
Plausible deniability
Barrier
Are people who dump their rubbish able to deny knowledge or responsibility for their actions?
Disgust
Barrier
We instinctively avoid unpleasant sounds and smells and emotions.
(Disgust as an adaptive system for disease avoidance behaviour)
Gamification
Driver
Introducing game-like mechanics into disposal behaviour, can make it more engaging, encouraging the desired behaviour.
Novelty
Driver
New and different bin designs will draw people’s attention.
(Novelty biases attention and gaze in a surprise trial. Attention, Perception, & Psychophysics)
Salient feedback
Driver
Providing clear feedback that rewards correct disposal and discourages dumping, helps people feel engaged with the process.
Moral licensing
Barrier
Doing something pro-social earlier that makes us feel good about ourselves, can make it more likely for us to engage in antisocial behaviour like dumping later.
(Sinning saints and saintly sinners: The paradox of moral self-regulation)
Trip chaining
Barrier
A chained trip means integrating correct waste disposal habits within an existing regular trip.
(A theoretical and empirical model of trip chaining behavior)
Ease
Driver
By making correct disposal easy, we can make it preferable to dumping.
Framing
Driver
The way information about dumping is presented will affect people’s attitudes and decisions.
(All frames are not created equal: A typology and critical analysis of framing effects)
The solution
The two conditions tested were based off the insights of “biophilia” and “affect”. Biophilia bins are based off research that suggests that exposure to flowers and nature prime people to act in a more pro-social manner. This was executed by wrapping the bins in imagery of flower fields and by placing flowers on the floor to act as an “exclusion zone” (The biophilia hypothesis) The other condition was based off the principle of “affect”. Adding affect means trying to integrate positive emotion into the desired behaviour (The affect heuristic). This was achieved by the playfully designed “monster” bins with equally playful calls to action. These, along with a control condition, were evenly distributed between 12 sites. The conditions tested were:
- Control condition (No change in bins)
- Biophilia condition (Flower bins with flower images on the ground)
- Affect condition (Monster bins with call-to-action messaging)
Pictures of the different designs are included below.
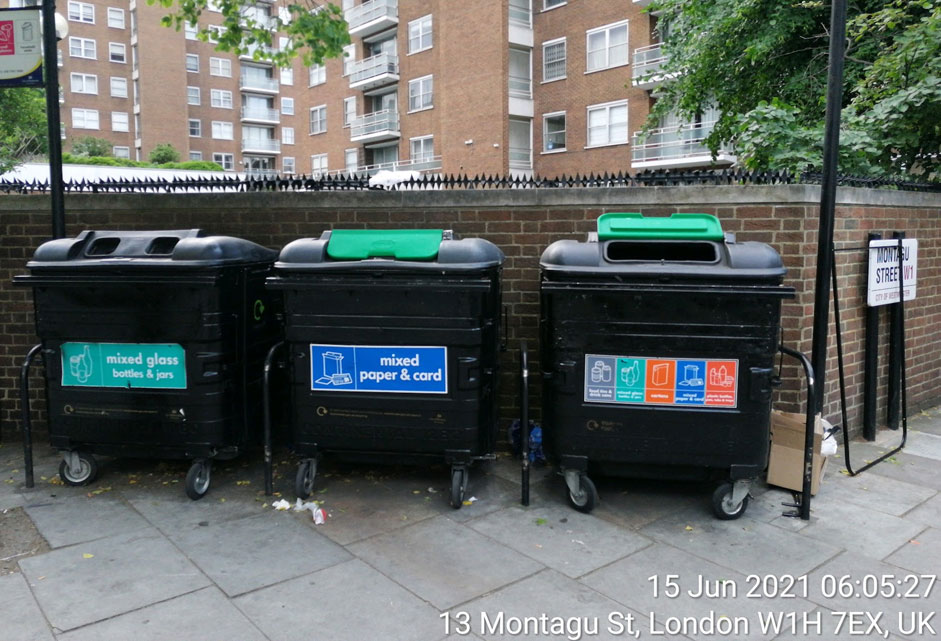
Control Condition
The control condition involved four sites, with no change in bin design, being measured during the same time period as the sites that did receive a change in bin designs. Measuring this allows us to test the efficacy of the interventions, while helping control for natural fluctuations in rubbish that occur in different time periods.
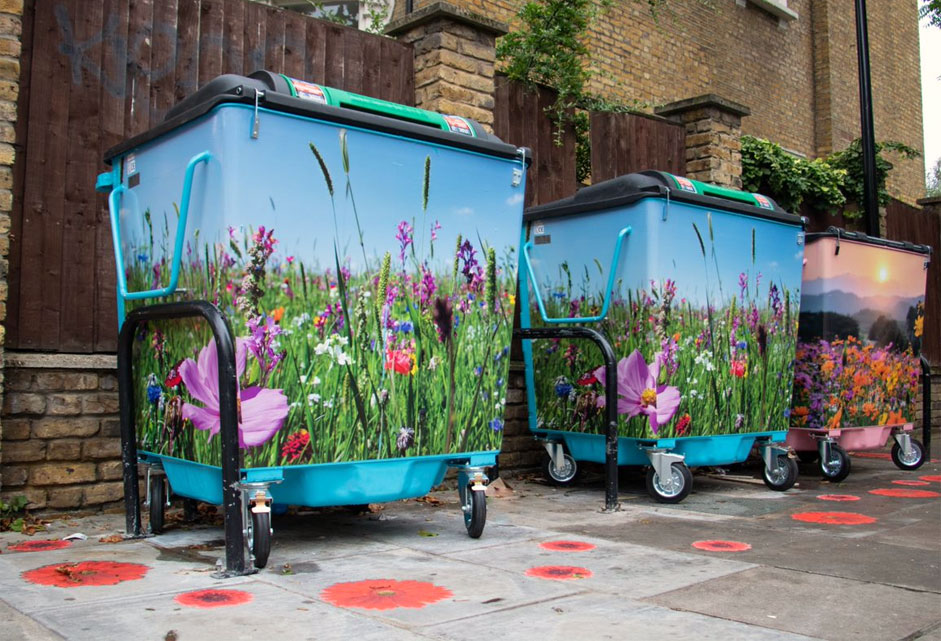
The Biophilia (Flower) Condition
The Biophilia condition had two components to it. The first was wrapping the bins in imagery of a flower field. The second, involved sticking cutouts of flowers on the floor around the bins.
These two design choices were intended to meet two objectives:
- To “Prime” pro-social behaviour in residents. Some research suggests that when exposed to nature, people behave more pro-socially. This is known as the “biophilia hypothesis”.
- To create an exclusion zone around the bins where dumping felt wrong.
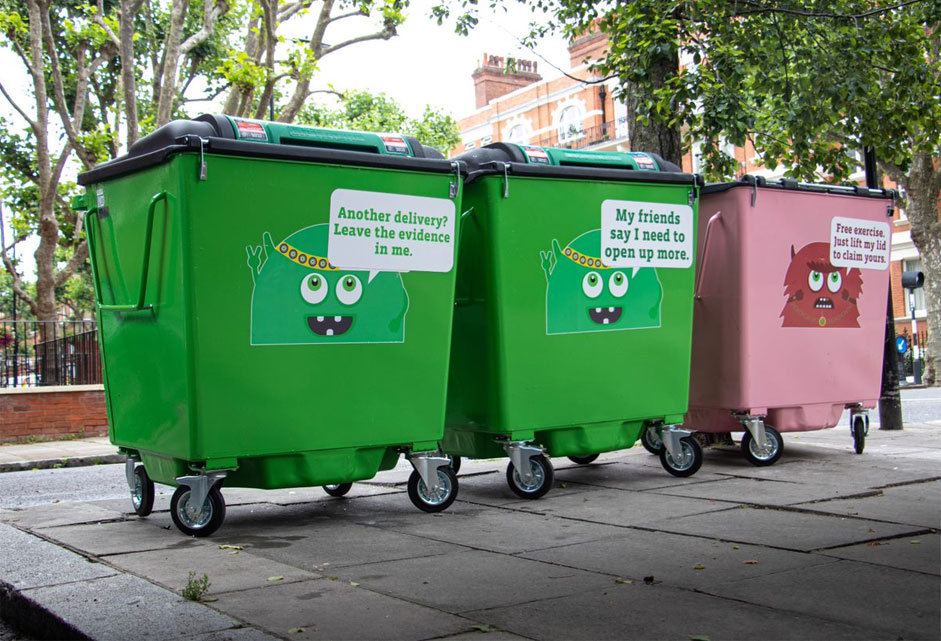
The Affect (Monster) Condition
The affect condition utilised playfully designed images of monsters that were applied to the bins and contained an attention-grabbing call to action message (“Trash talk”). These design choices were intended to meet the following objectives:
- To use novelty and humour to draw attention to the bins and the correct way to dispose.
- To use the direction of the gaze of the monsters as an affordance cue, directing people to lift the lid on the bin.
- The “Trash Talk” messages were written to generate intrigue, draw attention to the bins, and make people laugh.
The impact
Planned trial methodology
To capture the impact of our intervention, a Randomised Control Trial (RCT) was implemented across 12 sites in the City of Westminster area. This involved four sites being randomly allocated one of the three conditions. The allocation of sites are detailed below:
The control sites tested were:
- Gloucester Street J/W Lupus Street
- Warwick Square J/W Belgrave Road
- Leinster Terrace J/W Leinster Place
- Ilbert Street J/W Third Avenue
The biophilia sites tested were:
- Gloucester Street J/W Lupus Street
- Warwick Square J/W Belgrave Road
- Leinster Terrace J/W Leinster Place
- Ilbert Street J/W Third Avenue
The affect sites tested were:
- St Georges Drive J/W Denbeigh Street
- Ilbert St J/W Fourth Avenue
- Sutherland Street J/W Clarendon Street
- Craven Hill Gardens J/W Craven Hill
From the data collection, we obtained four weeks of usable baseline data, and four weeks of usable Phase 2 data. Baseline data is data from the period before the interventions were put into place. Measuring this allows us to control for preintervention levels of dumping behaviour. Phase 2 data is from the period after the new designs were implemented.
The data collection was carried out by the City of Westminster, and the processing of the data was carried out by Ogilvy. This allowed us to establish both baseline and phase 2 measurements for all three conditions for the following variables:
Dumped waste
- Black bags dumped
- Carrier bags dumped
- Recycling bags dumped
- Pieces of cardboard dumped
Large/bulky items dumped
- E.g. mattresses, wood, metal, furniture etc. Additionally, local residents in the area were interviewed to provide qualitative feedback on the new bin designs
Results
In this section you will first see the results for general dumped waste, then large/bulky items and then finally the resident’s perception of the new designs from an on-street survey.
How to interpret the data
During our trial, levels of dumped waste were recorded. This was done numerically, so if there was one black bag dumped outside the bins, this was recorded as a “1”. If there were two dumped black bags, then this was recorded as “2” and so on. Importantly, if there was no dumped waste, then this was recorded as “0”. Indicating that on that day, on that collection occasion, there was no dumped waste outside the bins. This process was the same for all categories of rubbish recorded (black bags, carrier bags, recycling bags, cardboard and large/bulky items.)
What’s an ANCOVA, Tukey test and p-value?
The above are all statistical techniques to ascertain whether we can be confident that the change we observe in the data was caused by the differing conditions and not some other extraneous factor.
An ANCOVA is the main test we use to see if the conditions had some kind of significant effect on the level of dumped waste. It automatically controls for levels of baseline rubbish, which makes it useful in this case. In terms of statistics, this means we are using levels of baseline rubbish as a “covariate”.
A Tukey test is used if the ANCOVA detects some kind of difference. The ANCOVA detects if something was statistically significantly different, the Tukey test detects what was statistically significantly. This is useful for interpreting, for example, if the statistical significance in the results observed, occurred between the flower and control, monster and control, or both.
p-values are how we decide if something is statistically significant or not. The general practice in academic research is that if the p-value is below 0.05 then it is deemed as statistically significant. We used this cut-off point for our tests too. The lower the p-value, the more confident you can be that what you observed was caused by the conditions and not something else. Occasionally you’ll see the p-value displayed in terms of “e”. e is just a very common number in mathematics like “pi”, so it has its own name “e”. In our case, when the p-value is expressed in terms of e, then this means that it is very low, almost zero. Which means you can be almost 100 per cent confident that the change you observed was because of the conditions tested and not something else.
Dumped waste (black bags, carrier bags, recycling bags, cardboard)
A one-way ANCOVA was conducted to compare the effectiveness of three bins at reducing dumped waste, whilst controlling for baseline levels of dumped waste. There was a significant difference in mean rubbish left on the street [F(2,2587) =38.3247, p<2e-16] between the different types of bins. Post hoc comparisons using the Tukey test were carried out. There was a significant difference between flower bin sites and control bin sites (p <1e-06) with flower bin sites having 0.66 more pieces of rubbish on average compared to the control. There was also a significant difference between flower bin sites and monster bin sites (p <1e-06) with flower bins sites having 0.67 more pieces of rubbish on average compared to the monster bin sites. Comparing the estimated marginal means showed that flower bin sites had the most rubbish on the streets (1.4 pieces of rubbish on average). While monster was the best (0.768 pieces of rubbish on average), which was slightly better than the control (0.778 pieces of rubbish).
| Test | Difference | Std. Error | t-value | p-value |
|---|---|---|---|---|
| Flower – Control | 0.65884 | 0.08759 | 7.521 | <1e-06 |
| Monster – Control | -0.01008 | 0.08762 | -0.115 | 0.993 |
| Monster – Flower | -0.66892 | 0.08757 | -7.639 | <1e-06 |
| Condition | Mean | Std. Error | df | lower | upper |
|---|---|---|---|---|---|
| Control | 0.778 | 0.0620 | 2587 | 0.656 | 0.899 |
| Flower | 1.436 | 0.0619 | 2587 | 1.315 | 1.558 |
| Monster | 0.768 | 0.0619 | 2587 | 0.646 | 0.889 |
Large, bulky items
IMAGE: Large bulky levels of rubbish between groups
A one-way ANCOVA was conducted to compare the effectiveness of three bins at reducing the number of large/bulky items dumped on the street whilst controlling for baseline levels of large/bulky items dumped on the street. There was a significant difference in mean large/bulky items left on the street [F(1,644)=3.100, p=0.046] between the different types of bins. Post hoc comparisons using the Tukey test were carried out. There was a significant difference between flower bin sites and monster bin sites (p=0.035) with flower bin sites having 0.261 more large/bulky items on average compared to the control. Comparing the estimated marginal means showed that flower bin sites had the most large/bulky items on the streets (0.650 large/bulky items on average). While monster was the best (0.388 large/bulky items on average), which was slightly better than the control (0.527 large/bulky items).
| Test | Difference | Std. Error | t-value | p-value |
|---|---|---|---|---|
| Flower – Control | 0.65884 | 0.08759 | 7.521 | <1e-06 |
| Monster – Control | -0.01008 | 0.08762 | -0.115 | 0.993 |
| Monster – Flower | -0.66892 | 0.08757 | -7.639 | <1e-06 |
| Condition | Mean | Std. Error | df | lower | upper |
|---|---|---|---|---|---|
| Control | 0.778 | 0.0620 | 2587 | 0.656 | 0.899 |
| Flower | 1.436 | 0.0619 | 2587 | 1.315 | 1.558 |
| Monster | 0.768 | 0.0619 | 2587 | 0.646 | 0.889 |
Attitudes and perceptions to new bin designs
In addition to the main trial, qualitative data was recorded to determine attitudes and perception to the new bin designs. To achieve this, WCC staff members stood by the bins to interview residents. The team asked an open question to residents, asking them to nominate whether they loved, hated or were indifferent to the bins. Those that engaged were then asked follow up questions regarding what they were there to do and their impact. The results from this indicated that most residents were in favour of the affect/character bin designs.
TABLE
Surprisingly, even more people like the floral designs of the biophilia bins. However, these proved to be the least effective in terms of alleviating the dumping problem.
TABLE
This was reflected in the qualitative feedback which was largely positive:
- “Thank you for trying to fix the dumping problem, it is nice to see someone cares”
- “My kids love the new bins and enjoy seeing them every day on the way to nursery”
- “Hopefully this will encourage people to do the right thing, although this is the worst site for dumping in this area”
- “I love them they cheer the area up”
- “They make the effort to be less drab – it’s nice for children”
However, some people disagreed or were confused as to their purpose.
- “They look ridiculous with the countryside scene in central London”
- “We would like to see more bins in this location to deal with the dumping”
- “I thought the flowers on the floor signalled where to put your bags”
- “Need to allow the recycling bin lids to open fully”
- “Prefer the bin with the window”
We have also reviewed the feedback by residents and local councillors, through email communications and twitter. Residents raised concerns that they felt the bins were increasing the levels of dumping on the streets, and that some of the bins were being damaged through use. Residents also complained that the new recycling trial bins, were locked and had an envelope through which to post waste, preventing residents from placing large bags directly inside the bins. This is standard practice for Westminster recycling bins and is in pace to reduce recycling contamination. However, many of the old black style bins have had their locks broken over time and residents are able to open the bins.
Results summary
The biophilia/flower bins were ineffective at reducing dumping behaviour and may have slightly increased on street waste. However, this may also indicate that people were using them more, but just using them incorrectly. Affect/monster bins did reduce all types of waste in absolute terms, but this effect was not large enough to be statistically significant. Neither condition had a statistically significant effect on dumped large/bulky items, but again affect condition performed the best in absolute terms. Public perceptions of the new bin designs were in positive when residents were surveyed on street. However, several residents made it clear that they did not, reporting that they had increased the dumping of rubbish on street.
Limitations
The following limitations may have impacted our ability to infer meaningful results from the data collected:
- Little room for improvement on average – As the grey dots on the plots above indicates, by far the most common reading was zero. This means that most of the time, there was no waste being dumped around these bin sites. This makes detecting any improvements in average dumping difficult, as there are few occasions to improve on.
- Potential contextual factors: The intervention measurements took place in August which may have had an influence on the amount of rubbish being disposed of. Events like school holidays, vacant student properties, pandemic related changes in living arrangements and habits, or other cultural moments could have influenced dumping behaviours.
Lessons learned
Despite the interventions not achieving the desired results, there are certainly some positive lessons to be learned that could benefit future endeavours to tackling this challenge.
Firstly, as is indicated by the high quantity of zeros in the data and from many of the photos equally, it appears that most of the time dumped waste is not being left outside the bins. However, on the occasions where dumping does occur, it can reach very high levels as some data points indicate a few instances where dumping of 10 items or more were left outside bins.
This infrequent and seemingly irregular pattern to dumping behaviour could inform future dumping reduction strategies. This would involve developing solutions that anticipate and target particularly heavy dumping days, rather than the likely more expensive approach of blanket interventions that run year-round.
Secondly, statistical significance for the flower condition was achieved though not in the originally desired direction. At present it is hard to conclude whether this represents an increase in dumping behaviour or just an increase in general bin site usage. However, what we can conclude is that it appears redesigning the cosmetic environment of the bins and the area around it can indeed change waste disposal behaviour. Therefore, this initial trial may be used as justification for pursuing more trials into this type of solution, but with new designs for the bins and surrounding environment.
Thirdly, reflecting on the methodology of the trial, there were both positive and negative learnings that would benefit future research undertaken by local authorities in this space:
- Data collection and processing can help diagnose the problem better – Judging the extent of waste disposal behaviour problems from observation and photos alone is not reliable. This trial demonstrated the usefulness of good data collection in public issues.
- Run longer trials – In general, one month is likely not long enough to detect statistically significant changes in reducing dumping behaviour, especially for large/bulky items where there are so few. Recording for one month also doesn’t allow for the trial to control for the natural fluctuations in dumping that may occur at different times of year.
Finally, from the designs themselves, there are some indications of what insights may be effective and what may be harmful.
- Biophilia seems to not be effective – Recreating the same psychological effects as nature, is difficult to achieve through just imagery alone. We recommend not pursuing interventions based on this insight any further.
- Exclusion zones need to be made salient – From the qualitative feedback it seems some people mistook the flowers on the floor to indicate where to put their bags rather than the where not to. This may explain the small uptick in dumped waste for the biophilia condition. However, this indicates that floor marking may be one area to pursue further, but with more salient indications of exclusion.
- Adding affect shows promise – The results from the affect bins showed a reduction in dumped waste across all types of rubbish. Which may provide some credence to investigating further redesigns. However, as the effect was not large enough to be deemed statistically significant, we cannot recommend expanding its usage in its current iteration.
- Change is welcomed by the community – The qualitative feedback from the community was largely very positive. The striking visual change caught residents’ attention, and many were appreciative someone was trying to fix the problem. And the playful execution of the affect bins made local children and their parents happy. Overall, it seems moving away from the industrial look of the existing bins, is a change welcomed by the community.
Contact
Claudia Hemsley ([email protected])
Mike Hughes ([email protected])
Peter Judodihardjo ([email protected])