Channels and the way we access and use them is continually changing, year on year, and whilst some constants prevail, it’s a landscape to keep a watching brief on to ensure well-crafted comms strategies and well targeted campaigns. The COVID-19 pandemic has shown just how important choosing the right channel for your communications is, as we’ve spent the last three months working hard to ensure that important public health messaging reaches the right people, especially our most vulnerable residents.
Channels and the way we access and use them is continually changing, year on year, and whilst some constants prevail, it’s a landscape to keep a watching brief on to ensure well-crafted comms strategies and well targeted campaigns. The COVID-19 pandemic has shown just how important choosing the right channel for your communications is, as we’ve spent the last three months working hard to ensure that important public health messaging reaches the right people, especially our most vulnerable residents.
It will be just as important that we understand this landscape fully in shaping our recovery communications activity and allowing us to live with the virus.
We know that digital channels and their reach continue to grow in the UK. But also, that non-digital channels should still play a part in the channel mix of a campaign or plan. The biggest and most influential social media platforms –YouTube, Facebook, Instagram and Twitter - are established and aren’t going anywhere any time soon. Yet newer platforms can still emerge and play a role. TikTok for example has emerged and established itself mainly amongst young people in a relatively short space of time. Perhaps more relevant to local government is NextDoor, a free app that allows for targeted messaging to local communities at ward level.
Web and email continue to play a significant part in local government and large audiences and visitor traffic has been built up over years of work. Councils have told of large spikes in web traffic and email sign-up and opening rates during COVID-19 and this is an area of opportunity in the recovery stages too.
Paid for channels continue to represent a problem for many councils working with greatly reduced budgets over the past 10 years, and this shows no sign of letting up. Investment can pay for itself though and shouldn’t be ignored where there is a business case and financial pay back benefit.
As with any communications and engagement activity it’s important to assess the insights and data available in order to make informed decisions about which channels to use and to focus most resource on. Sometimes this can be very obvious, but at other times it will come with experience and experimentation on what works best, with who, why, when and how. None of us knew what to expect of the crisis when it hit, but the experiences and practices of council communicators leave us with some valuable lessons learned that we can apply to the next phase.
UK channel landscape in 2020
Tech, devices, channels and our changing usage
Watches and wearable tech
- Smart speakers now feature in 20 per cent of UK homes
- Smart watches and wearable tech are now owned by 23 per cent of homes
Phones
- 94 per cent of UK adults own a mobile phone
- 79 per cent of UK adults now own a smartphone
- And of those smartphone users we on average use them for 2 hours 34 minutes per day
Internet and TV
- 87 per cent of UK homes have internet access, and broadband features in 82 per cent of homes
- 94 per cent of UK homes have a TV set – 48 per cent have a smart TV
- 58 per cent of us watch TV on demand now
- Paid-for on demand TV is now accessed by 40 per cent of UK homes
- 51 per cent of UK adults use the internet for paying bills, and 46 per cent of us for online shopping
- 19 per cent of us look for public service information on Government web sites
Podcasts
- 1 in 8 UK adults listen to an hour of podcasts per week
- Podcast listening in the UK is split 52 per cent female, 48 per cent male
- Podcasting is a solo activity – 90 per cent of us listen to podcasts on our own
- Driving or travelling is the activity when we are most likely to listen to a podcast
- Entertainment is the top podcast genre
- 66 per cent of us listen to the whole episode when we listen to a podcast
- 44 million UK citizens send and receive emails each week
- 49 per cent of us use internet and instant messaging
- Average open rate in UK public sector is 33 per cent - Granicus UK
- Average click rate in UK public sector is 5 per cent - Granicus UK
Social media
- 70 per cent of UK adults have a social media account
- 32 per cent of 16 – 25 year olds believe social media gives them a voice to influence positive change
- 9 in 10 internet users in the UK use YouTube every month
- Facebook users spend on average 23 minutes per day on the platform
- 1 in 5 UK minutes online are spent on social media – and on average 39 minutes per day each
- But 21 per cent of 10-year-olds have a social media account despite the legal age being 13
Source – Ofcom Communications Market Report, 2019
The 5 R’s – A simple guide to choosing your channels wisely
Research
We know that all of our communications should be insight-led. Exploring all available channel data can pay off by taking out some of the guess work, as well as providing helpful evidence if you’re asked to deliver activity which you don’t feel will be effective.
Know your channel insights inside out and across web, email, social and offline channels.
Understand your benchmark data too - for example, your average email open and click rates and then compare them to your latest activity.
Likewise with Twitter and Facebook – what does your average engagement look like and when is best to post and with what type of content.
Role
It may sound obvious but understanding what role a channel plays in a campaign is vital. We often receive requests from services for specific tactical activity, for example ‘we need a video’. There needs to be an understanding of why that is the best tactics and needs to be backed by the evidence. Challenge when asked to deliver activity you don’t believe will work best. You’re the experts on the role of channels.
For example, Lewes District and Eastbourne Borough Council, who operate shared services, have very different demographics. The councils’ channel use had to reflect this. In Lewes district, the council’s offer to non-shielded vulnerable residents was communicated through a letter from their leader and deputy leader. The letter was sent in hard copy to all homes in the district along with a leaflet promoting the Community Hub through which residents can access food packages from the council and local food banks. This approach was taken because of the potentially vulnerable rural communities in the area.
In Eastbourne, the council took a targeted approach, sending the Community Hub information to vulnerable residents, using public health and social demographic data to deliver leaflets to the areas of greatest need. They also used a community magazine, The Eastbourne Voice, which was facing financial difficulty in the crisis by part funding its hard copy print run in exchange for carrying multiple pages on Covid-19 related council information. In both areas the councils utilised local community and voluntary groups to deliver hard copy leaflets to areas and individuals using these groups local knowledge. The communications team, which is shared across the two councils, backed up all of the above activity with frequent briefings to members, a social media campaign, use of the traditional media, daily Facebook live Q&As, online interviews with a local MP and local radio interviews.
Reach
Understand – and share in your monthly reports and internal guidance – the reach of each of your channels. For example, knowing your social media followings, and the geographical and demographics of them, is really important. And compare your email subscription numbers to your overall population. Assess their reach, and target improvements where necessary.
Rank
Know and use your most influential channels by rank. LinkedIn may be beneficial for B2B engagement but its ranking will be low for regular resident engagement. Likewise, sometimes a highly targeted piece of print collateral through specific small post code locations in your area can be effective where digital take-up is lower than UK averages.
Resources
This means more than simply budget – officer time and available skills must be employed of the most important channel activity in your campaigns. So for example, if you have an in-house designer in your council, it’s common that they get stretched too far and pulled in to too many projects at one time. This will reduce their ability to research, think and experiment with creative executions for your campaigns. Use these resources wisely in order to get the most of their skills and offer.
For this reason, many councils have been working with their local newspaper during the crisis. To ensure all within the borough’s community, especially hard to reach groups such as the elderly, vulnerable and disadvantaged, had access to important key messages from a range of public bodies, as well as positive community-led news, Woking Borough Council took the bold decision to partner with its local paid-for newspaper, the Woking News and Mail. Since 13 April 2020, the partnership has delivered a weekly 16-page newspaper to all households in the borough and parts of the neighbouring borough that mirrors the newspaper’s circulation area by Royal Mail’s door-to-door delivery service. That’s around 48,500 properties.
Whilst maintaining their independence, officers have worked closely with the newspaper’s editorial team to ensure a balance of council and partner news and positive community-led features. Feedback from the community has been positive, with many appreciating the delivery of weekly news and information. To support the borough’s recovery, the partnership has been extended to deliver a weekly 24-page newspaper to all households until the end of June 2020.
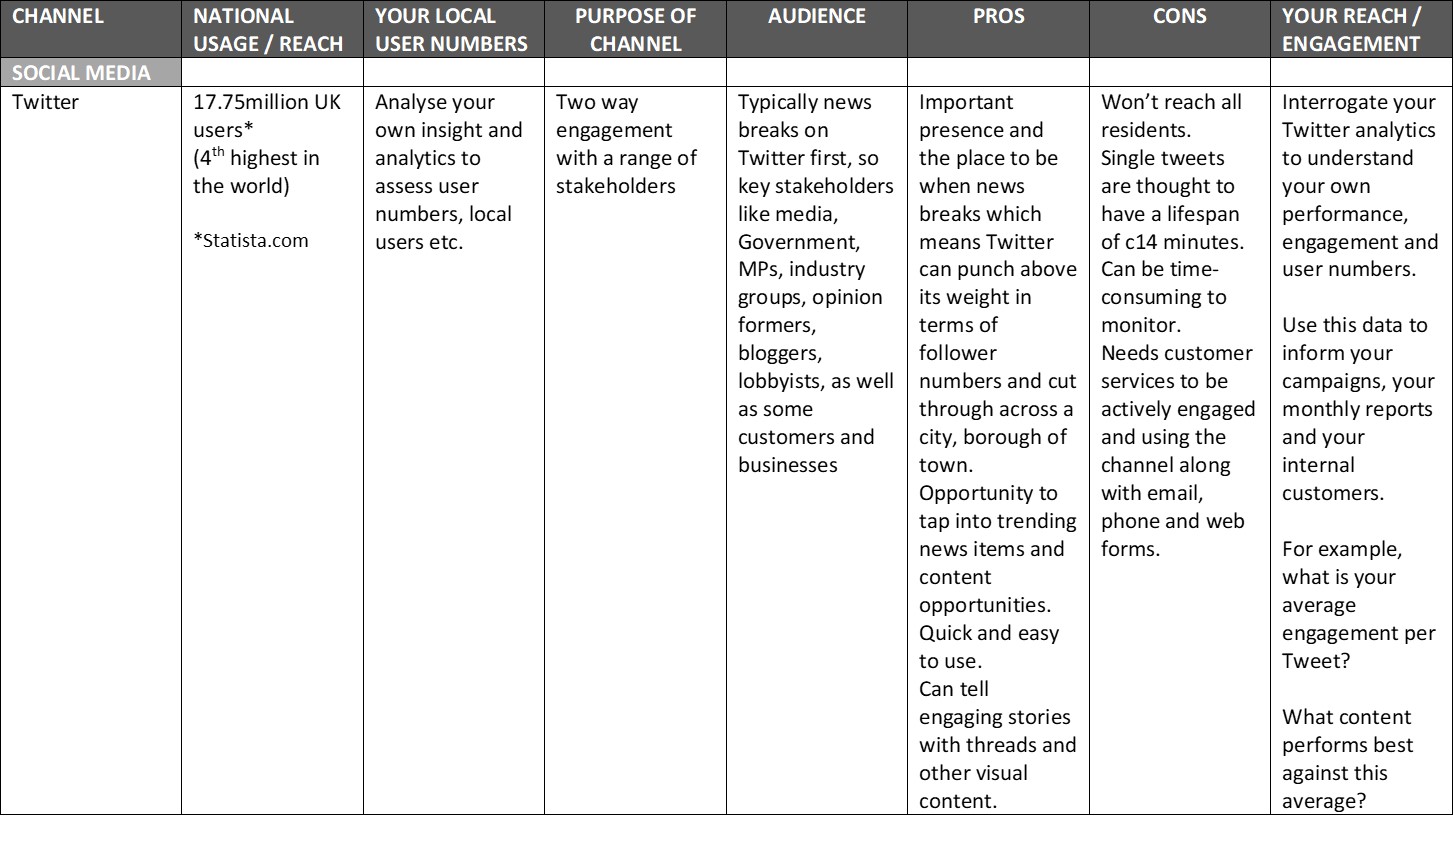
Channels matrix - choosing the best channels to support your campaigns and plans - Twitter
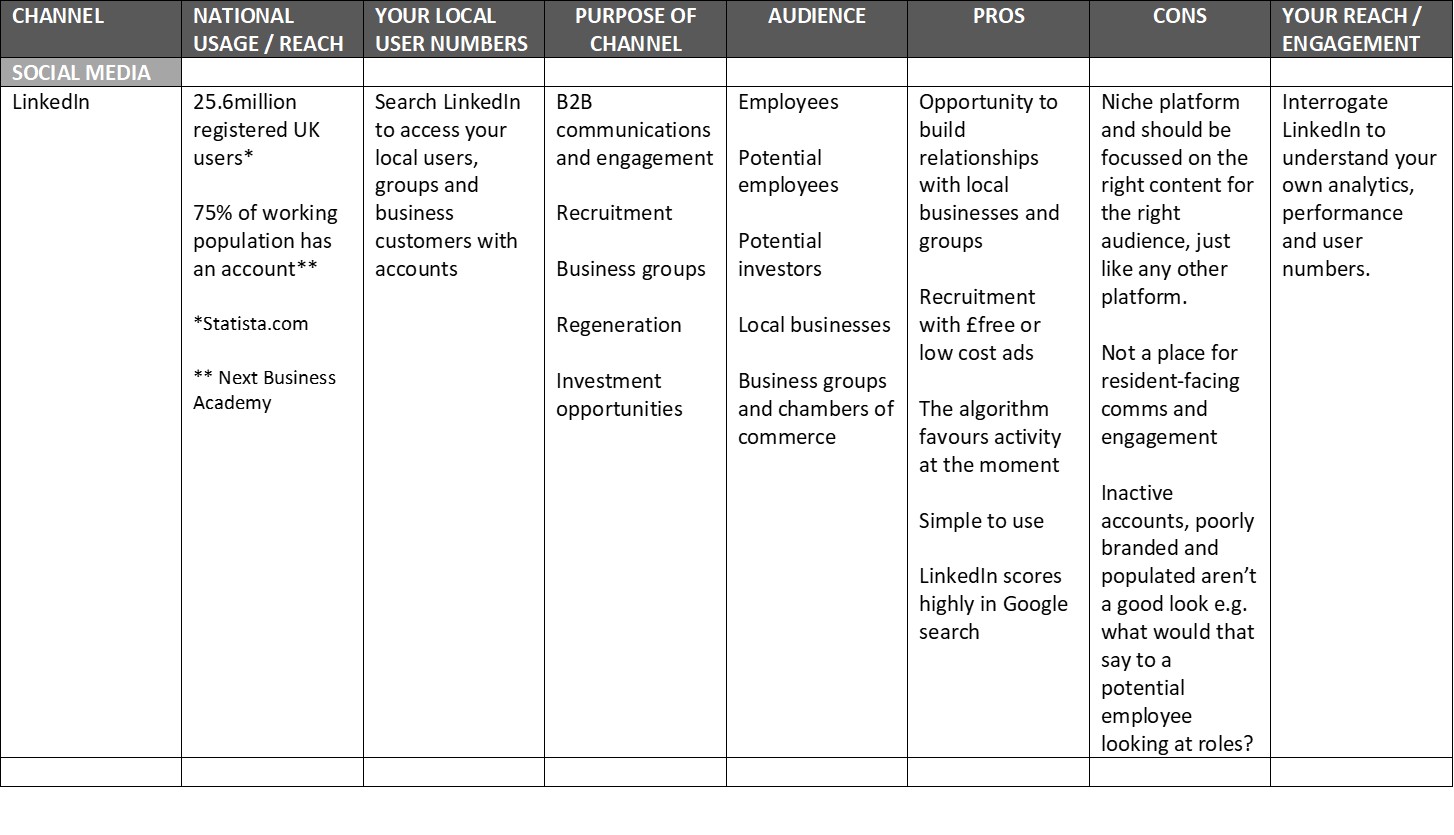
Channels matrix - choosing the best channels to support your campaigns and plans - LinkedIn
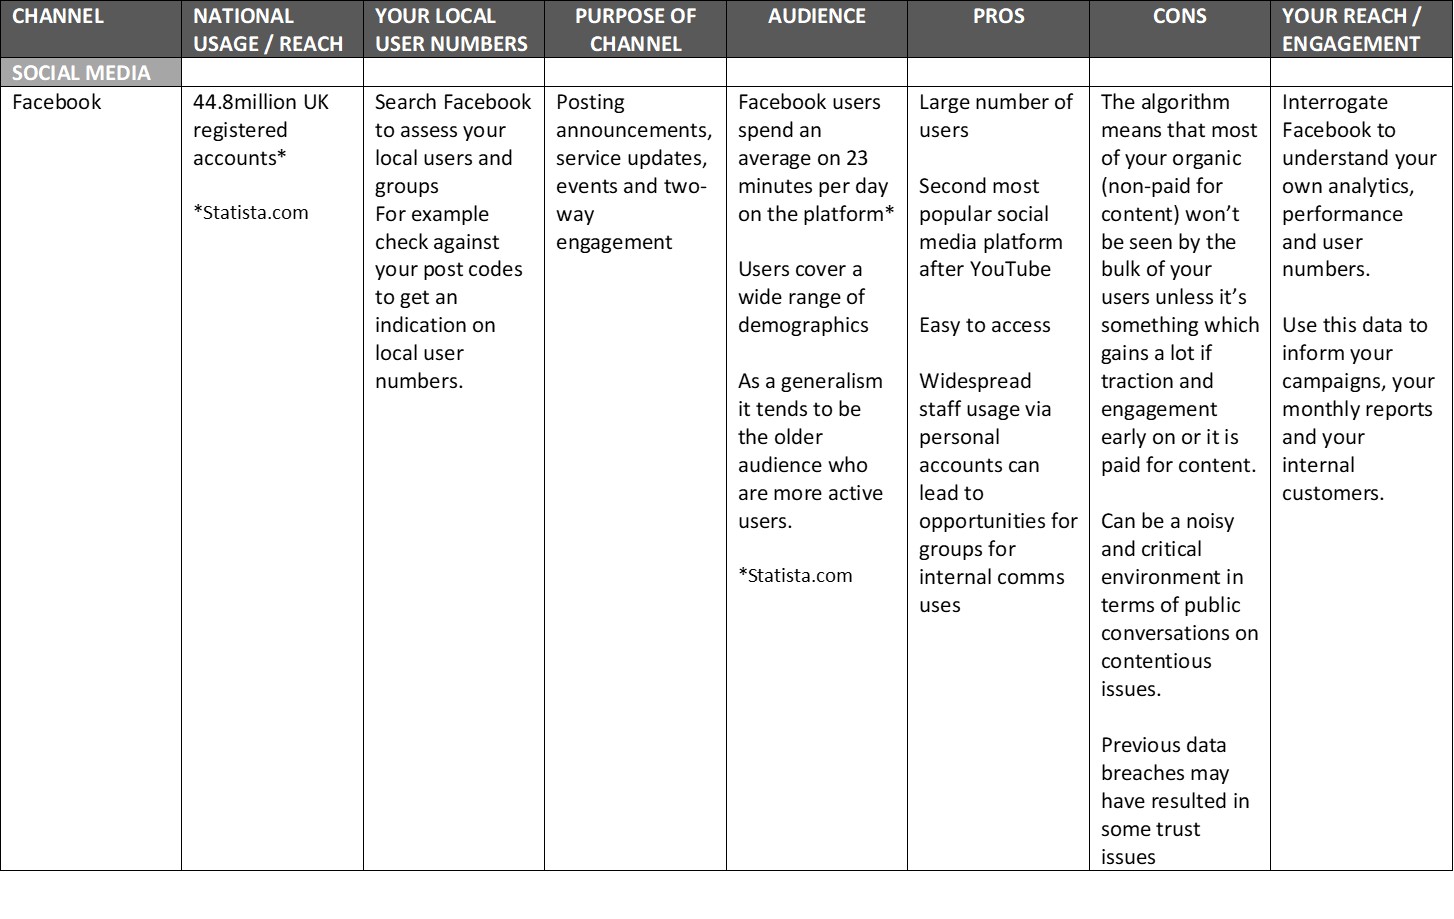
Channels matrix - choosing the best channels to support your campaigns and plans - Facebook
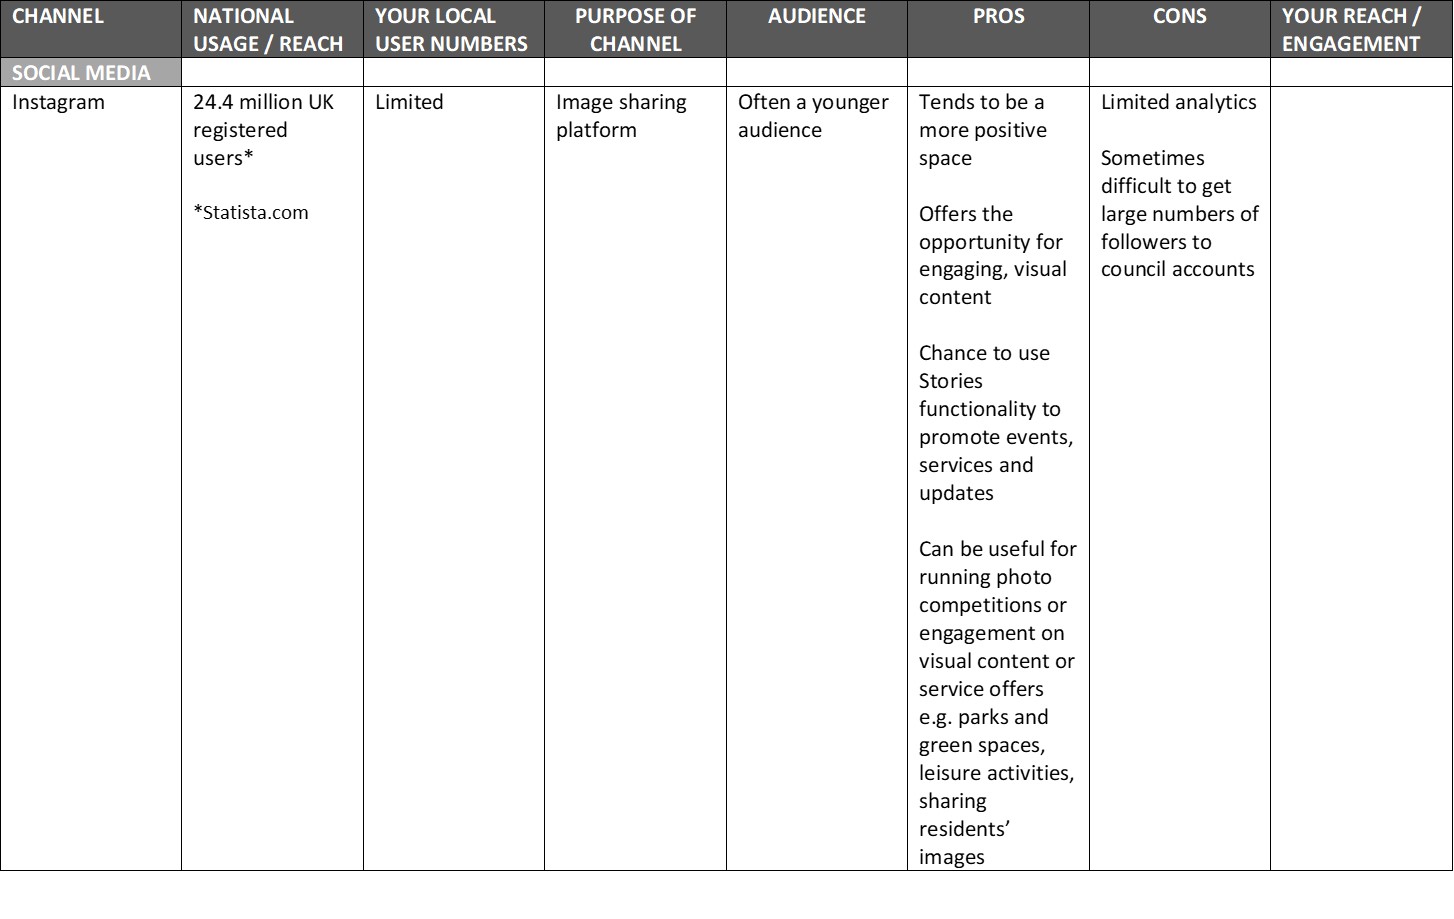
Channels matrix - choosing the best channels to support your campaigns and plans - Instagram
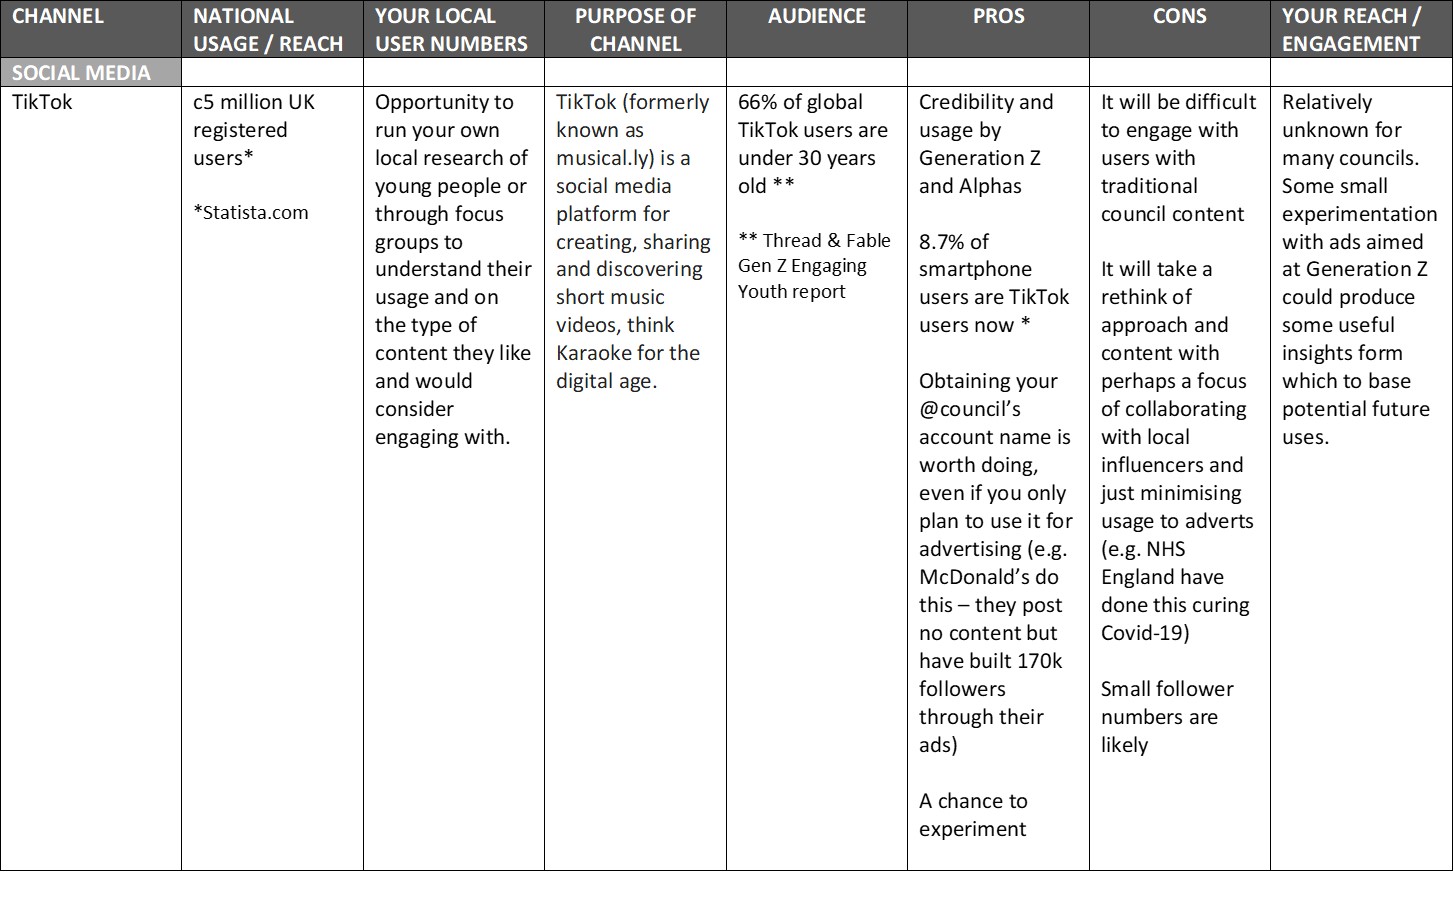
Channels matrix - choosing the best channels to support your campaigns and plans - TikTok
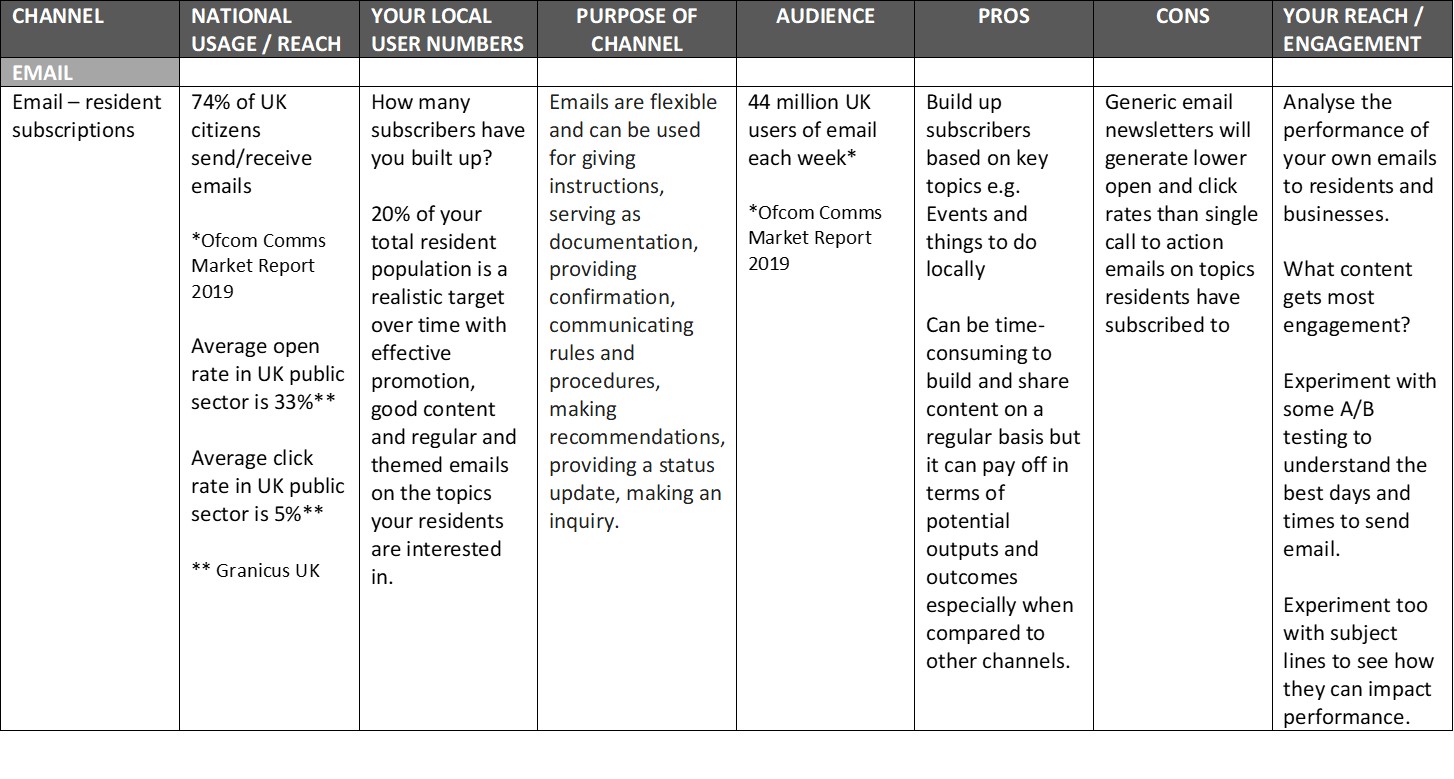
Channels matrix - choosing the best channels to support your campaigns and plans - Email
Covid-19 channel performance case study – Derbyshire County Council
Performance review covers all digital activity from 16 March 2020 to 31 May 2020:
- 4.5 million organic Facebook reach
- 120 per cent increase compared to normal average activity
- 2.1 million Twitter impressions
- 121 per cent increase compared to normal average activity
- 5,000 inbound social media customer messages/comments
- 40 per cent increase compared to normal average activity
- 6,200 new social media followers
- 4.2 million website page views
- 230,000 Derbyshire Now email opens and 2,000 new Derbyshire Now subscribers
- 614,000 paid social media reach
- 25,000 conversions
Inbound activity
Inbound social media activity includes all incoming comments, direct messages and tags from the public to our two main corporate channels on Facebook and Twitter. This could be queries, complaints, questions, praise etc from the public.
- 5000 inbound social media comments/messages during this period
- This is a 40 per cent increase compared to the same dates in 2019 or a normal period of the same length in time
- 40 per cent of inbound activity comes on a Wednesday and Friday
- 12-1pm and 4-5pm are the most popular time of day for enquiries to come in on social media
Facebook performance
- 334 posts
- 34,600 total Facebook followers
- 4,000 new followers during this period
- 13% increase in followers during this 11 week period (normally average 10% increase in a year)
- 45,000 profile views
- 180 per cent increase compared to normal period of the same length of time
- 4.5 million post reach
- Average of 400,000 post reach a week
- 120 per cent increase in reach compared to normal average activity
- Highest reach for individual posts were 373K, 217K and 173K
- 124 individual posts had a reach of over 10,000 people
- 9.2 per cent average engagement rate (average industry benchmark is 0.13%)
- 150 per cent increase on normal average engagement rate
Twitter performance
- 582 posts
- 50,200 total Twitter followers
- 2,200 new followers during this period
- 5 per cent increase in followers during this 11 week period (normally average 10 per cent increase in a year)
- 2.1 million impressions
- Average of 190,000 impressions a week
- 121 per cent increase in impressions compared to normal average activity
- Highest impressions for individual posts were 60K, 43K and 33K
- 7.2K link clicks
- 213 per cent increase on normal average link clicks
- 3.5K retweets
- 255 per cent increase on normal average retweets
- 1.5 per cent average engagement rate (average industry benchmark is 0.06 per cent)
- 114 per cent increase on normal average engagement rate
Paid social media performance
Care recruitment campaign (ongoing)
Facebook:
- 400,535 people reached
- 2,408,125 impressions (number of times ads appeared on screen)
- 15,209 conversions
Google Adwords:
- 69,100 people reached
- 3,050 conversions
Recycling centre campaign (ongoing)
Facebook:
- 144,016 people reached
- 218,370 impressions (number of times ads appeared on screen)
- 6,639 conversion
Website performance overview
All website
- 4.2 million total page views
- 3.1 million total unique page views
- 1 minutes 5 seconds average time spent on website
Coronavirus
- 470,000 page views to coronavirus pages
- 353,721 unique page views to coronavirus pages
- 2 minutes 35 seconds average time spent on coronavirus pages
Highlights
Waste recycling centres – 115,555 visits, an increase of 6488 per cent
Household waste recycling centres – 104,680 visits, an increase of 2078 per cent
Intranet performance overview
All website
- 10,000 users
- 7,000 internal using DCC devices/network
- 3,000 from external devices
- 1 million total page views
- 729,000 total unique page views
- 3 minutes 30 seconds average time spent on website
Coronavirus
- 89,000 page views to coronavirus pages
- 61,000 unique page views to coronavirus pages
- 1 minute 56 seconds average time spent on coronavirus pages
Email performance
- 94,889 total subscribers
- 3,800 new subscribers during this period
- 194,998 total subscriptions
- 10,500 new subscriptions during this period
- 363 email bulletins sent from all email topics (all departments) during this period
- 1.4 million email opens
- 112 per cent increase in email opens compared to normal average activity
- 70 per cent average engagement rate across all emails
Digital magazine performance
Website:
- 20,000 page views
- 15,000 unique page views
Social media:
- 590,000 Twitter impressions
- 10,000 Twitter engagements
- 327,000 people reached on Facebook
Video:
- 22,000 views of the Derbyshire spirit video across all channels