Introduction
The social care workforce faces increasing challenges and understanding these are key to shaping a workforce that can respond and adapt to changes.
1.54 million people currently work in the social care sector. As of November 2021, there are 99,191 registered social workers and 41,318 registered occupational therapists. 7,900 children and family social worker posts are vacant, an increase of 21 per cent from the previous year, and there are 165,000 adult social care vacant posts, up from 52 per cent since 2020/21. The number of children’s agency workers increased to 6,800 up by 13 per cent and is the highest number seen.
The employer standards survey, sometimes known as the ‘health check’, gives a voice to registered social workers, occupational therapists, and non-registered social care professionals and allows them to feel listened to and that their employer is proactive in tackling challenges.
The purpose of the survey was to better understand a number of critical questions about their experiences including:
- How well do employers deliver the employer standards?
- How do employees perceive their working environment?
- What factors influence them to remain engaged with their work and minded staying with their organisations?
The employer standards for social workers were refreshed in 2020. The standards set out the shared core expectations of employers which will enable social workers in all employment settings to work effectively and safely.
Please note that this summary report relies primarily on data collected from social workers, occupational therapists and non-registered social care professionals employed by local authorities and related agencies. While the data is considered to represent a reasonable, representative national sample, no claims are made for generalisation of the results to other areas of the UK.
Executive summary
This year, the survey received over 16,000 responses from 140 organisations which is an increase of almost 60 per cent of responses from the year before (2021). The list of organisations that participated can be seen in Appendix C.
This document will outline the key findings from the survey. It will compare the standards with the previous year’s survey (2021) and will summarise some key findings that have emerged from the responses, including:
- effective workforce planning systems
- dissatisfaction with continuing professional development
- unchanged perception of safe caseloads and work allocation
- the differences in responses between permanently employed social workers and social workers who are represented by an agency, are locum/interim or independently, in relation to:
- the employer standards
- the workplace experiences
- administrative burdens
The employer standards
- Standard 1 – Strong and clear social work framework: Promoting a clear statement about the principles that constitute good social work practice.
- Standard 2 – Effective workforce planning systems: Using effective workforce planning systems to make sure that the right resources are available to meet current and future service demands.
- Standard 3 – Safe workloads and case allocation: Ensuring employees do not experience excessive workloads, resulting in unallocated cases and long waiting times for individuals.
- Standard 4 – Wellbeing: Promoting a positive culture for employee wellbeing and supporting social workers to practice effectively and safely.
- Standard 5 – Supervision: Making sure students and qualified practitioners can reflect critically on their practice through integrated high quality, regular supervision.
- Standard 6 – Continuing professional development (CPD): Providing the time and opportunity for social workers to learn, keep up to date and critically reflect on the impact this has on their practice.
- Standard 7 – Professional registration: This standard is about supporting social workers to maintain their professional registration with the regulator.
- Standard 8 – Strategic partnerships: Creating strong partnerships and good collaboration between employers, higher education institutions and other training providers.
Participants
The survey received 7,843 responses from registered social workers, who contributed to 49 per cent of the total survey responses. The survey was carried out from October 2022 until January 2023.
The charts below show the breakdown of survey responses by occupation and job category.
|
Occupation |
Percentage of survey responses |
Number of survey responses |
|---|---|---|
|
Registered Social Workers |
49% |
7839 |
|
Non-Registered Social Care Professionals |
41% |
6582 |
|
Occupational Therapists |
10% |
1573 |
|
Social work category |
Percentage of survey responses |
Number of survey responses |
|---|---|---|
|
Adults’ Social Workers |
56% |
4387 |
|
Children’s Social Workers |
35% |
2763 |
|
Mental Health Social Workers |
9% |
689 |
The data from the survey was interpreted using a mean average score for each question as the survey sought to measure attitudes and opinions on a scale. Respondents were asked to select options from ‘strongly disagree’ to ‘strongly agree’. The mean score is used to determine the average performance of a question so it can also be referred to as the average satisfaction score and can be converted to the same number as a percentage to indicate the average percentage of the score relative to the total score.
Scores or percentages for a question between 0-50 indicate a low outcome, scores between 51-74 indicate a moderate outcome and scores between 75-100 indicate a good outcome.
Statistically significant
This term describes a mathematical measure of difference between groups. Throughout the report, the term ‘statistically significant’ may be used. A difference of 5 percentage points demonstrates that a difference in a response is statistically significant. A difference of less than 5 is not considered statistically significant, but these responses may still be shown to make comparisons.
The standards overall: how well do employers deliver the refreshed employer standards?
The employer standards for social workers set out the shared core expectations of employers which enable social workers in all employment settings to work effectively and safely. In 2022, the overall performance of the standards across adults, children’s and mental health registered social workers were similar, with children’s social workers responding slightly less favourably to 5 out of 8 of employer standards in comparison to adult’s and mental health social workers, but these differences were not statistically significant. Tables in Appendix B provide a visualisation of the mean average scores across all employer standards for social workers by job category for 2021 and 2022.
The most favourably received standard for 2022 was standard 2 (effective workforce planning systems) with a mean score of 82 per cent and the least favourably received standard was standard 6 (continuing professional development) with a mean score of 74 per cent, though standard 6 increased by 2 percentage points from 2021.
Three of the employer standards received no changes in satisfaction from the year before. This shows there are no changes to how social workers perceive workload and case allocation (standard 3 – mean score 77 per cent), supervision (standard 5 – mean score 77 per cent) and professional registration (standard 7 – mean score 80 per cent) from 2021. A further three standards received an increase in satisfaction, showing an improvement in how social workers perceive effective workforce planning systems (standard 2 – mean score 82 per cent) wellbeing (standard 4 – mean score 79 per cent) and continuing professional development (standard 6 – mean score 74 per cent). Two standards declined in satisfaction, showing a slight decrease in favourability in strong and clear social work framework (standard 1 – mean score 80 per cent) and strategic partnerships (standard 8 – mean score 77 per cent).
Regional differences
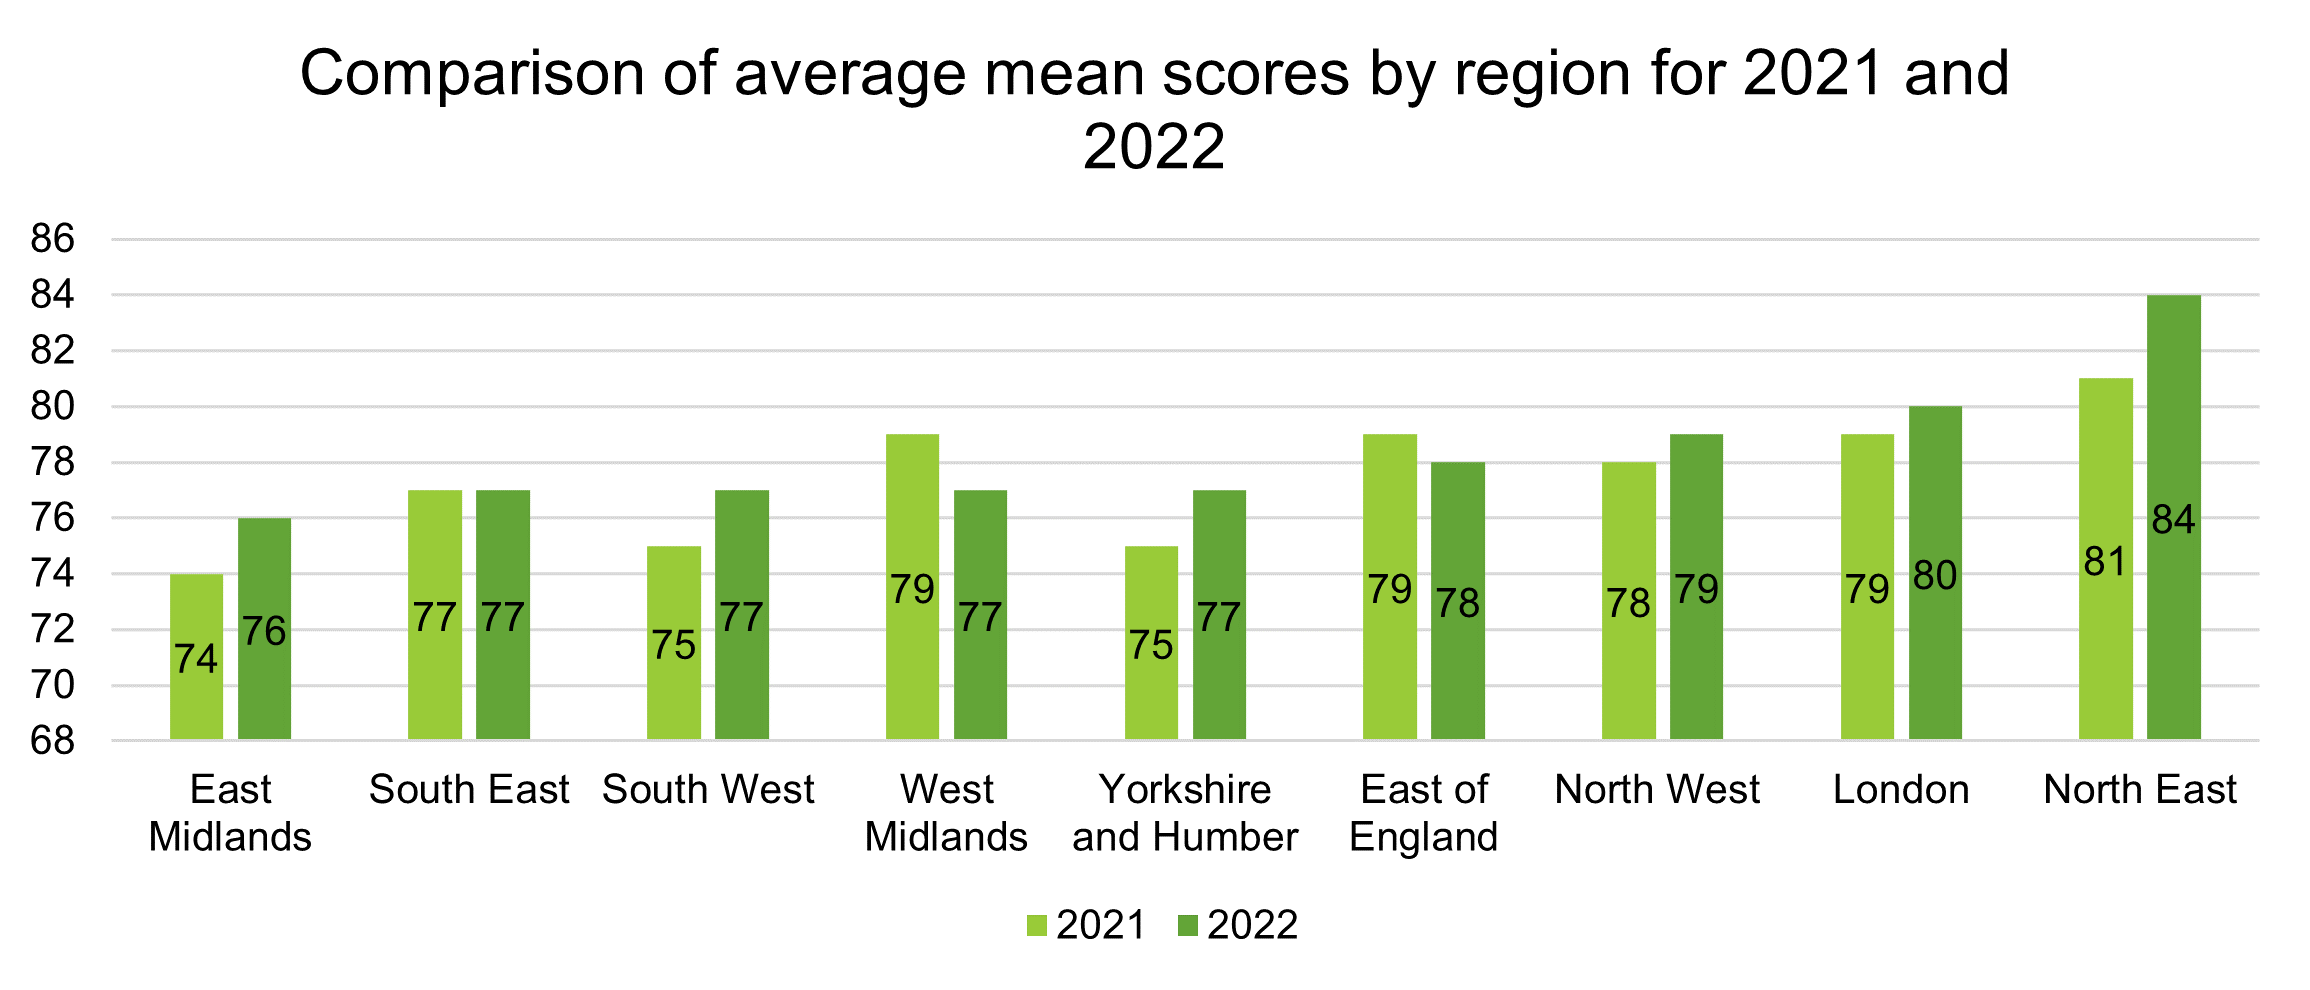
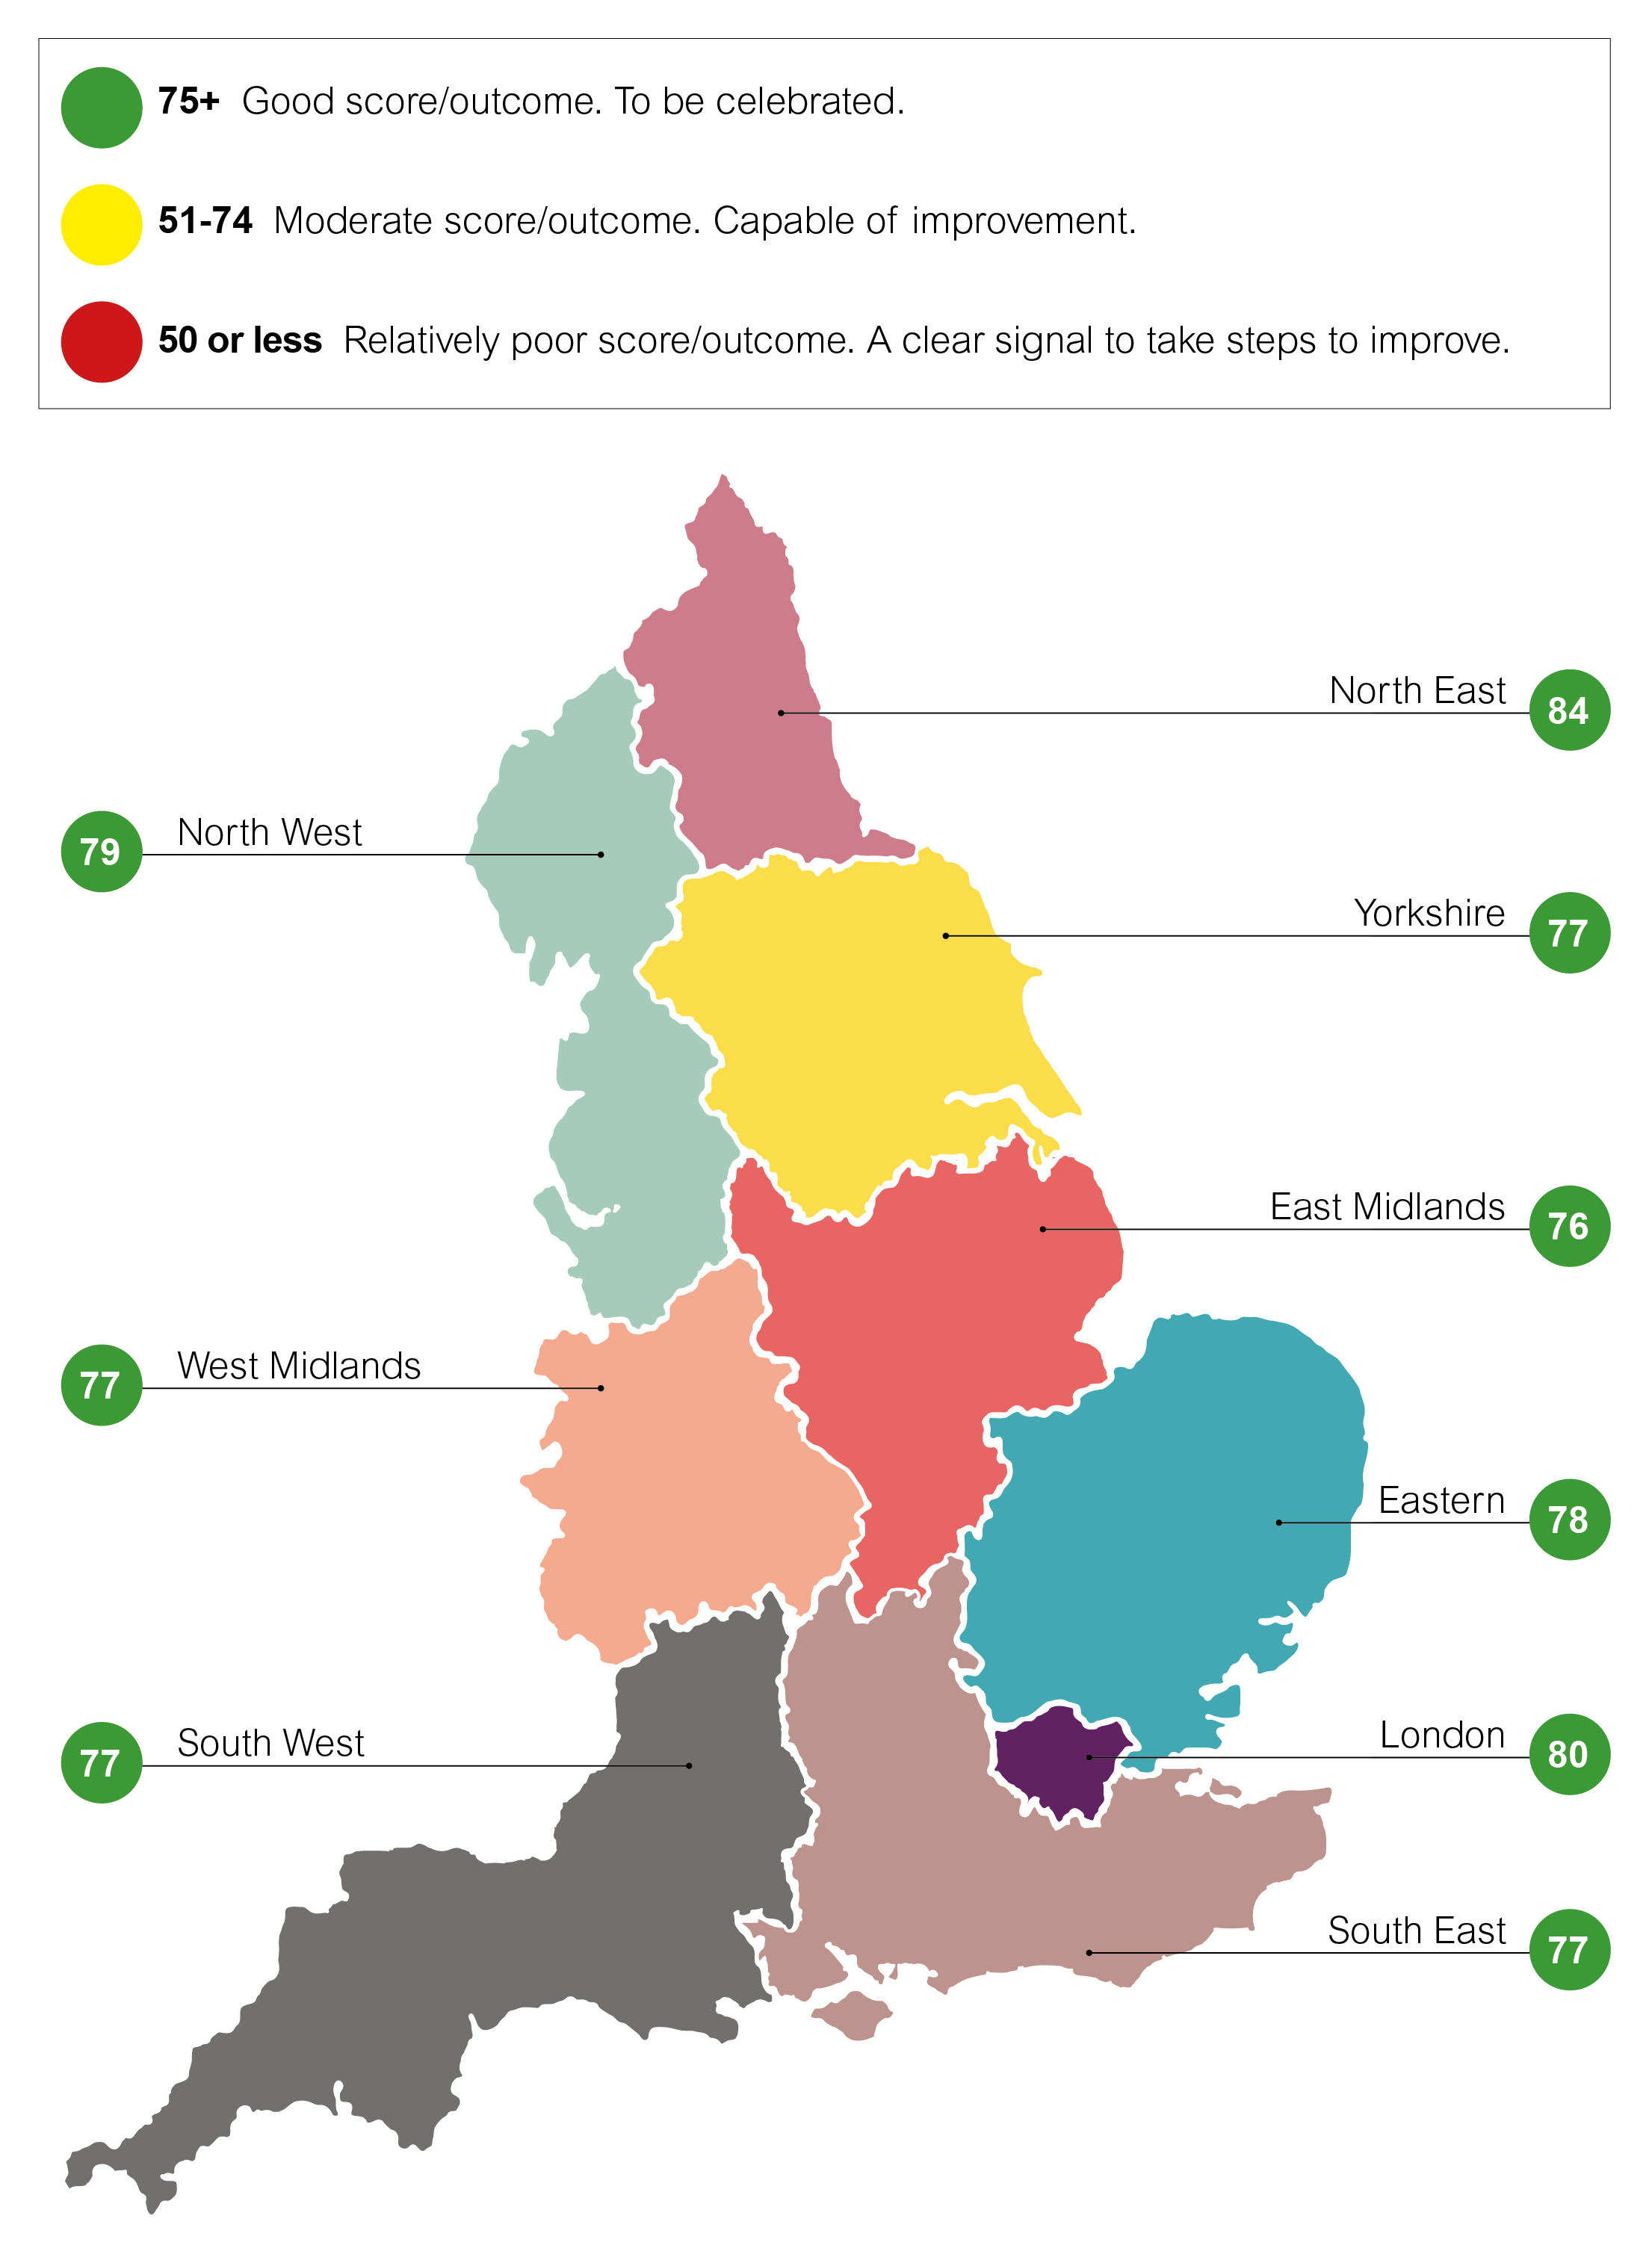
The overall mean performance of the employer standards for each region is shown in Appendix A. A bar chart and visual image are also shown below.
All regions responded to the standards with scores in the ‘good’ range (75+) and 6 out of the 8 regions showed an improvement in satisfaction with the overall standards.
Social workers in the North East of England responded to the standards most favourably (mean score of 84 per cent) in comparison to social workers from the East Midlands who responded to the standards least favourably (mean score of 76 per cent) which shows a statistically significant difference in satisfaction of 8 percentage point between the East Midlands and North East. Although the lowest mean score was from the East Midlands, the satisfaction score from the East Midlands has increased by 2 points from the previous year (2021). When comparing the lowest performing standard (6) between the North East and East Midlands, there was a statistically significant percentage point difference of 9. This can be seen in Appendix A.
Key findings
Effective workforce planning systems (standard 2)
This standard received an overall mean score of 82 per cent and it was the most favourably received out of the 8 employer standards. In 2020, this standard received a mean score of 78, showing it has increased by 4 percentage points in 2 years.
Social workers strongly agree that they feel they are treated fairly and respectfully by all staff and that their supervisors or line manager encourage and motivate their career development. Similarly, social workers feel that they can access the training and development needed to carry out their role well and understand how their role fits into the organisational structure, however mental health social workers responded less positively that they understand how their ‘role fits into the organisation structure alongside the routes of entry and progression’ with a statistically significant difference on 5 percentage points to this question in comparison to adults’ social workers. The response to the rest of the questions for standard 2 were similar across the three occupational groups.
All but one question in this set received a mean score of 80+ which is in the good range (75+).The lowest scoring question that received a score in the moderate range (51-74) asked social workers whether they feel that their employer understands the barriers and challenges they face that get in the way of doing their best work. The question set for standard 2 can be seen in Appendix B.
Continuing Professional Development (standard 6)
This standard received an average mean score of 74 per cent, which is the top end of the ‘moderate’ range (51-74)
Standard 6 was the least favourably received standard across the 8 employer standards, which was also the case in the survey last year in 2021. In 2020, standard 6 received a score of 71 per cent, showing that this standard has improved slightly with an overall increase of 3 percentage points in 2 years. Children’s registered social workers responded slightly less favourably to 6 out of the 8 of the questions in standard 6 in comparison to adult’s and mental health social workers, but these responses were not statistically significant, with the exception to when social workers were specifically asked about appraisals and development plans. In these two questions that can be seen in Appendix B, there were statistically significant differences in satisfaction of 5 percentage points in response from children’s registered social workers.
The questions in the set for standard 6 were amongst those that received the lowest level of satisfaction scores as almost every question in the set received a ‘moderate’ mean score (51-74) with the exception where social workers strongly agreed that they keep up to date with their CPD and that their organisation provided non-discriminatory and transparent systems to enable them to develop. Some of the questions and mean scores can be seen in Appendix B which ask social workers how they feel about their professional development.
The low scores captured in the tables in Appendix B show that social workers do not feel entirely satisfied that they have the dedicated time, resources, and opportunities to carry out their CPD, and do not feel that they have an up-to-date plan of their professional development needs and how their employer will contribute to them. There is also room to improve the satisfaction from the AYSE programmes to help social workers develop and learn since the average overall score for this question had just entered a ‘good’ score range (75+).
Similarly, the scores suggest that there is room to improve the inductions and appraisal performance review systems so that they are more effective. Employers should be providing opportunities for regular and effective CPD and should provide support and information to enable social workers to progress and develop.
Safe caseloads and work allocation (standard 3)
This standard received an average mean score of 77 per cent.
The response to this standard remained unchanged when comparing it to the score from last year’s survey in 2021. In 2020, this standard received a mean score of 78 per cent showing there has been very little change to how social workers perceive the allocation of their workload and ability to balance their case work with the resources they have. Children’s social workers responded less favourably to all questions in this question set for standard 3 but not significantly so, with the exception to one question that asked social workers about the wellbeing support that is readily available to them. Children’s social workers responded significantly less favourably to this question with a statistically significant difference of 5 percentage points in satisfaction when comparing the response from adult’s registered social workers. This can be seen in Appendix B.
Most questions in this data set scored in the ‘good’ range’ (75+) however questions around caseloads specifically were close to the boundary of a ‘moderate score’. Some of the questions asked about caseload and work allocation can be seen in Appendix B.
In particular, when social workers were asked about balancing the demands of their casework, this question received a mean average score of 67, which was among the most poorly performing questions overall. The responses in this set show social workers generally feel that their work is allocated through a fair process and can access wellbeing support, though these questions also scored on the boundary of a moderate (51-74)/good (75+)range. This suggests that if there is no further improvement to the workload and case allocation, there could be a decrease in satisfaction levels across standard 3. Employers should continue to ensure work is allocated fairly and transparently and that social workers’ workload is assessed regularly to take account of work complexity, individual worker capacity and time needed for supervision and CPD.
Differences between registered social workers who are permanently employed and social workers who are represented by an agency, are a locum, interim or independently working social worker
7 per cent of registered social workers who were surveyed were represented by an agency, were locum/interim or independently working social workers.
Employer Standards
The survey found differences in satisfaction across the 8 employer standards when comparing social workers who are employed permanently and social workers who are represented by an agency, are locum/interim or independent working social workers. The table in Appendix B shows that social workers who are represented by an agency, are interim, locum or independent workers expressed higher levels of satisfaction across all but one standard (standard 6 - continuing professional development) in comparison to social workers who are employed permanently.
In particular, there are strong and statistically significant differences of 5 percentage points when comparing the performance of the standards in relation to a strong and clear social work framework, safe workloads and case allocation, and supervision.
The Workplace Experiences
The survey also asked social workers some supplementary questions to understand how they feel about their workplace experiences generally which can be seen in the table in Appendix B. The set of questions asked in the workplace experiences section sought to answer how social workers feel about their employee experience and their employment package more generally.
When focusing on social workers’ perception of the workplace, the data showed that there were some strong and statistically significant differences in the responses when comparing the experiences of social workers who are permanently employed and social workers who are represented by an agency, are locum/interim or independently working. In particular, the strongest difference of 12 percentage points can be seen when social workers were asked about whether they feel they must do more with fewer resources. Overall, permanently employed social workers feel less satisfied with their employment package and respond less positively across every work experience question.
Appendix B shows a breakdown of some of the lowest-scoring workplace experience responses that compare social workers who are employed permanently and social workers who are represented by an agency, are locum/interim or independently working.
Administrative burden
As part of the supplementary questions, social workers were also asked how they feel about the paperwork they must complete in their role which can be seen in table 9 in the appendix. In response to the statement which asked whether social worker’s ‘role involves burdensome paperwork’ this question received scores ranging from 72-74, showing general agreement with this statement. This question can be seen below in the table. There was a small difference in the response to this question where mental health social workers responded with less agreement to this statement than adult’s and children’s social workers
The data shows that social workers agree that their role involves burdensome paperwork that has little to no impact on the outcomes of families which may limit the effectiveness of their work.
|
Social Work Occupation |
My role involves burdensome paperwork activities that have no or limited impact on outcomes for families (mean average) |
|---|---|
|
Adults’ Social worker |
74 |
|
Children’s Social worker |
74 |
|
Mental Health Social worker |
72 |
Demographics
Ethnicity
The proportion of survey respondents by ethnicity and scores of the overall standards can be seen in Appendix C. Registered social workers who were from an Asian or Asian British – Other background and social workers from a Black or British – African background responded to the standards the most favourably (mean average score of 86 per cent) in comparison to social workers from a Mixed – White and Asian background who responded less favourably (mean average score of 69 per cent). Social workers who preferred not to state their background responded the least favourably to the standards overall (mean score of 68 per cent).
There were not enough responses to generate an overall mean score for registered social workers who were from an Arab background.
Disability
16 per cent of surveyed registered social workers expressed that they have a disability and the performance of the standards in relation to disability can be seen in appendix C. The data shows there are differences in how the standards are received when comparing social workers who have a disability (mean score of 75 per cent) and those who are non-disabled (mean score of 80 per cent). Social workers who declared they were disabled responded less favourably to the standards with a decrease in satisfaction of 5 percentage points and those who preferred not to state if they had a disability responded the least favourably to the standards overall (mean score of 67 per cent).
|
|
Mean average overall score of standards |
|---|---|
|
Disabled |
75 |
|
Non-disabled |
80 |
|
Prefer not to say |
67 |
Gender
81 percent of surveyed registered social workers identified as female, 14 percent identified as male, less than 1 per cent identified as non-binary and less than 1 per cent identified as transgender. The proportion of survey respondents by gender and scores across the employer standards can be seen in Appendix C.
The performance of the standards across the male and female social workers was similar however, there were differences in how the standards performed overall when comparing the responses from social workers who identify as non-binary and social workers who preferred not to state their gender. Social workers who identified as non-binary responded less favourably to the standards (mean score of 65 per cent) and social workers who preferred not to state their gender responded the least favourably to the standards overall (mean score of 64 per cent).
There were not enough responses to generate an overall score for social workers who identified as transgender or other.
|
Gender |
Mean average overall score of standards |
|---|---|
|
Female |
80 |
|
Male |
78 |
|
Transgender |
- |
|
Non-binary |
65 |
|
Other |
- |
|
Prefer not to say |
64 |
Age
The proportion of survey respondents by age and the performance of the standards when comparing the age of survey respondents can be seen in appendix C. Registered social workers who are aged 65+ responded to the standards most favourably (mean score of 84 per cent) in comparison to social workers who are aged 25-34 who responded less favourably (mean score of 78 per cent). Social workers who preferred not to state their age responded least favourably to the standards overall (mean score of 67 per cent).
|
Age |
Mean average overall score across standards |
|---|---|
|
24 and below |
82 |
|
25-34 |
78 |
|
35-44 |
79 |
|
45-54 |
79 |
|
55-64 |
79 |
|
65 + |
84 |
|
Prefer not to say |
67 |
Key drivers
Using multiple regression techniques on the data, the three ‘drivers’ - survey items having the greatest impact or potency on employees’ overall contribution in the workplace - are shown below. Improving these key drivers will have the greatest impact on social workers’ contribution.
Standard 7 – ‘My organisation promotes a working environment that upholds ethical practice and quality standards.’
Average mean score: 82
This is surfacing perceptions about an organisation’s promotion of ethical practice and quality standards.
Standard 4 – ‘My organisation recognises the emotional demands of social work and provides me with supervision, support, and tools I need to deal with this.’
Average mean score: 72
This provides a sense of how social workers feel their organisations recognise the emotional demands of their jobs and provide appropriate support of various kinds.
Standard 3 – ‘I am usually able to balance the demands of case work and the resources needed to fulfil my responsibilities’
Average mean score: 67
This question is concerned with the ability to balance resources and demands, that enable social workers to fulfil their job role.
Conclusion
The survey has demonstrated that social workers feel that they are treated fairly and are motivated and encouraged in their development since standard 2 (effective workforce planning systems) was the most favourably received employer standard.
Nonetheless, social workers have persistently responded to continuing professional development (standard 6) the least favourably across the 8 employer standards which is affecting their professional development, though there has been an increase in satisfaction from 2020 and 2021 towards standard 6. There has also been very little to no change to the way social workers perceive safe caseloads and work allocation (standard 3) and the response to the question around balancing caseloads specifically received one of the lowest overall satisfaction scores from the survey. It is important to ensure that social workers feel satisfied that they have enough time, resources, and opportunities to undertake CPD, and that they are able to balance the demands of their casework, in order to enable social workers to reflect and demonstrate their skills and knowledge throughout their careers and not experience excessive caseloads.
Across the three social work occupations, children’s social worker’s responded slightly less favourably to 5 out of the 8 employer standards, but these lower satisfaction scores were not statistically significant differences. There were specific questions that did however show significant differences for areas that could be that could be improved for children’s social workers especially in relation to the well-being support available to them, appraisals, and development plans.
Delving deeper, the survey has shown that there are very clear and significant differences in satisfaction across the perception of the standards and workplace when comparing the responses to the survey from permanently employed social workers and social workers who are represented by an agency, are locum/interim and independently working.
Whilst there has been a slight improvement to some standards, the data has shown that remaining standards such as supervision, safe caseloads and work allocation and professional registration have received no change in satisfaction, so it is important to ensure these standards improve and that the remaining standards for strong and clear social framework and strategic partnerships do not decline further and affect the volume and quality of social work.
Appendix A
|
Standards |
2021 |
2022 |
Percentage Point Difference |
|---|---|---|---|
|
Standard 1 Strong & clear social work framework |
83 |
80 |
-3 |
|
Standard 2 Effective workforce planning systems |
78 |
82 |
+4 |
|
Standard 3 Safe workloads and case allocation |
77 |
77 |
0 |
|
Standard 4 Wellbeing |
76 |
79 |
+3 |
|
Standard 5 Supervision |
77 |
77 |
0 |
|
Standard 6 Continuing Professional Development |
72 |
74 |
+2 |
|
Standard 7 Professional registration |
80 |
80 |
0 |
|
Standard 8 Strategic partnerships |
79 |
77 |
-2 |
|
Standards |
Adults Registered Social worker |
Children’s Registered Social worker |
Mental Health Registered Social worker |
|---|---|---|---|
|
Standard 1 Strong & clear social work framework |
80 |
81 |
79 |
|
Standard 2 Effective workforce planning systems |
82 |
82 |
81 |
|
Standard 3 Safe workloads and case allocation |
78 |
75 |
78 |
|
Standard 4 Wellbeing |
80 |
77 |
78 |
|
Standard 5 Supervision |
78 |
75 |
76 |
|
Standard 6 Continuing Professional Development |
75 |
72 |
74 |
|
Standard 7 Professional registration |
81 |
79 |
80 |
|
Standard 8 Strategic partnerships |
80 |
80 |
77 |
|
Region |
Mean score in 2021 |
Mean score in 2022 |
Difference |
|---|---|---|---|
|
East Midlands |
74 |
76 |
+2 |
|
South East |
77 |
77 |
0 |
|
South West |
75 |
77 |
+2 |
|
West Midlands |
79 |
77 |
-2 |
|
Yorkshire and Humber |
75 |
77 |
+2 |
|
East of England |
79 |
78 |
-1 |
|
North West |
78 |
79 |
+1 |
|
London |
79 |
80 |
+1 |
|
North East |
81 |
84 |
+3 |
|
Region |
Standard 6 - Continuing Professional Development |
|---|---|
|
East Midlands |
71 |
|
North East |
80 |
|
Difference |
9 |
Appendix B
|
Question |
Adults’ social worker |
Children’s social worker |
Mental Health social worker |
|---|---|---|---|
|
I feel I am treated fairly and respectfully by all staff |
84 |
82 |
85 |
|
My supervisor and/or manager encourage and motivate me in my career development |
82 |
81 |
83 |
|
I can access the training and development I need to carry out my role well |
83 |
84 |
83 |
|
My employer understands the barriers and challenges that are getting in the way of doing my best work |
74 |
74 |
73 |
|
I understand how my role fits into the organisational structure alongside routes of entry and progression for practitioners. |
85 |
86 |
81 |
|
Question |
Adults’ social worker |
Children’s social worker |
Mental Health social worker |
|---|---|---|---|
|
(If you have completed the ASYE in the last three years in your current organisation) My ASYE programme was effective in helping me learn and develop as a social worker and be more confident |
77 |
74 |
75 |
|
I take action to ensure I am up to date with my CPD |
91 |
90 |
92 |
|
My organisation has non-discriminatory and transparent systems to enable all social workers to develop their professional skills, knowledge, specialisms and AMHP, Practice Educator, Practice Supervisor careers including access to accredited courses |
82 |
81 |
83 |
|
Within my organisation, I have an up-to-date plan of my professional development needs and how I and my employer will contribute to them |
66 |
61 |
66 |
|
I have dedicated time, resources, opportunities and support to carry out my CPD and record my learning in line with regulatory requirements |
66 |
63 |
65 |
|
My organisation provides effective induction for all social workers when they join the organisation |
71 |
70 |
67 |
|
My organisation provides regular/ annual appraisals (or performance reviews) that are relevant for social workers |
73 |
67 |
71 |
|
Through my organisation, I can access funded non-mandatory CPD |
73 |
73 |
71 |
|
Question |
Adults Registered Social worker |
Children’s Registered Social worker |
Mental Health Registered Social worker |
|---|---|---|---|
|
I am usually allocated work through a fair process that takes account of my workload, my capabilities/ skills and my health and wellbeing |
76 |
73 |
77 |
|
The wellbeing support I need at work is readily available to me. |
78 |
73 |
76 |
|
I am usually able to balance the demands of case work and the resources needed to fulfil my responsibilities |
68 |
65 |
66 |
|
I can discuss workload and stress issues helpfully with my supervisor or manager and agree satisfactory ways forward |
80 |
76 |
79 |
|
I would feel able to contact my Professional Association and/or Trade Union if I am concerned about safe working |
82 |
80 |
82 |
|
I can freely share work issues with my team members, in the interests of managing my workload |
84 |
82 |
85 |
|
Standards |
Employed Permanently |
Agency/Locum /Interim /Independent |
Percentage Point Difference |
|---|---|---|---|
|
Standard 1 Strong & clear social work framework |
80 |
85 |
5 |
|
Standard 2 Effective workforce planning systems |
81 |
84 |
3 |
|
Standard 3 Safe workloads and case allocation |
77 |
82 |
5 |
|
Standard 4 Wellbeing |
79 |
82 |
3 |
|
Standard 5 Supervision |
76 |
81 |
5 |
|
Standard 6 Continuing Professional Development |
74 |
73 |
-1 |
|
Standard 7 Professional registration |
80 |
83 |
3 |
|
Standard 8 Strategic partnerships |
80 |
81 |
1 |
|
Question |
Employed Permanently |
Agency/locum/interim/independent |
Percentage Point Difference |
|---|---|---|---|
|
I feel positive and able to cope with work most of the time |
74 |
81 |
7 |
|
I would be happy to recommend my employer to a friend, as a place to work |
74 |
83 |
9 |
|
Overall, I am satisfied with my employment package– what my employer provides for me and what I am expected to provide in return |
70 |
80 |
10 |
|
I feel that the Senior Leadership Team value and understand the work that I do |
67 |
78 |
11 |
|
I am often required to do more with less resources |
81 |
69 |
12 |
|
Job Category |
My role involves burdensome paperwork activities that have no or limited impact on outcomes for families |
|---|---|
|
Adults’ Social worker |
74 |
|
Children’s Social worker |
74 |
|
Mental Health Social worker |
72 |
|
Ethnicity |
Mean average overall score of standards |
|---|---|
|
Asian or Asian British - Other |
86 |
|
Black or Black British - African |
86 |
|
Black or Black British - Other |
84 |
|
Asian or Asian British - Bangladeshi |
82 |
|
Asian or Asian British - Indian |
80 |
|
Asian or Asian British - Pakistani |
80 |
|
Mixed - White & Black African |
79 |
|
White - British |
79 |
|
Asian or Asian British - Chinese |
78 |
|
Mixed - Other mixed |
78 |
|
White - Other |
78 |
|
Black or Black British - Caribbean |
77 |
|
Mixed - White & Black Caribbean |
77 |
|
Any other ethnicity |
74 |
|
White - Irish |
73 |
|
Mixed - White & Asian |
69 |
|
Prefer not to say |
68 |
|
Arab |
- |
Appendix C
| Ethnicity | Number of respondents |
|---|---|
| White British | 5.3k |
| Asian or Asian British – Indian | 0.2k |
| Black or Black British – African | 0.5k |
| Black or Black British – Caribbean | 0.2k |
| White – Irish | 0.1k |
| White – other | 0.4k |
| Prefer not to say | 0.5k |
|
|
Mean average overall score of standards |
|---|---|
|
Disabled |
75 |
|
Non-disabled |
80 |
|
Prefer not to say |
67 |
|
Gender |
Mean average overall score of standards |
|---|---|
|
Female |
80 |
|
Male |
78 |
|
Transgender |
- |
|
Non-binary |
65 |
|
Other |
- |
|
Prefer not to say |
64 |
| Gender | Proportion of respondents |
|---|---|
| Female | 81% |
| Male | 14% |
| Transgender | <1% |
| Non-binary | <1% |
| Other | <1% |
| Prefer not to say | 4% |
|
Age |
Percentage of social workers |
|---|---|
|
24 and below |
2% |
|
25-34 |
16% |
|
35-44 |
26% |
|
45-54 |
28% |
|
55-64 |
22% |
|
65 + |
2% |
|
Prefer not to say |
4% |
|
Age |
Mean average overall score across standards |
|---|---|
|
24 and below |
82 |
|
25-34 |
78 |
|
35-44 |
79 |
|
45-54 |
79 |
|
55-64 |
79 |
|
65 + |
84 |
|
Prefer not to say |
67 |
List of organisations who participated in the survey
Barnsley MBC
Bath & NESC
BCP Council
Birmingham CC
Blackburn with Darwen BC
Blackpool Council
Bolton Council
Bracknell-Forest Borough Council
Bradford MC
Brighter Futures for Children
Brighton and Hove City Council
Bristol City Council
Buckinghamshire Council
Bury MBC
Calderdale Metropolitan Borough Council
Cambridge and Peterborough
Central Bedfordshire
Cheshire East
Cheshire West and Chester Council
Cornwall Council
Coventry City Council
Cumbria County Council
Derby City Council
Derbyshire County Council
Devon County Council
Dorset Council
Dudley MBC
Durham MBC
East Riding of Yorkshire
East Sussex County Council
Essex County Council
Gateshead Council
Gloucestershire County Council
Halton Borough Council
Hampshire County Council
Hartlepool Borough Council
Hertfordshire County Council
Hull City Council
Isle of Wight
Jersey
Jewish Care
Knowsley MBC
Lancashire County Council
LB Barking & Dagenham
LB Barnet
LB Bexley
LB Brent
LB Croydon
LB Ealing
LB Enfield
LB Hackney
LB Haringey
LB Harrow
LB Hillingdon
LB Hounslow
LB Islington
LB Lambeth
LB Lewisham
LB Merton
LB Newham
LB Redbridge
LB Southwark
LB Sutton
LB Tower Hamlets
Leeds and York Partnership NHS Foundation Trust
Leeds City Council
Leicester City Council
Leicestershire County Council
Lincolnshire County Council
Lincolnshire Parternship NHS FT
Live Well South West Trust (Provider to Plymouth)
Liverpool City Council
Luton Borough Council
Manchester City Council
Medway Council
Middlesborough Council
Midlands Partnership NHS FT (Provider to Staffordshire)
Milton Keynes Council
Newcastle upon Tyne City Council
Norfolk County Council
North East Linconshire Clinical Commissioning Group
North Lincolnshire Council
North Northamptonshire Council
North Somerset Council
North Tyneside Council
North Yorkshire County Council
Northamptonshire Children's Trust (Part of Council)
Northumberland Council
Nottingham City Council
Nottinghamshire County Council
Oldham Council
Oxfordshire County Council
Plymouth City Counci
Portsmouth City Council
RB Greenwich
RB Kingston upon Thames
RB of Windsor and Maidenhead (Optalis)
Reading Borough Council
Redcar and Cleveland County Council
Richmond and Wandsworth
Rochdale Metropolitan Borough Council
Rotherham Metropolitan Borough Council
Rutland County Council
Salford NHS Trust
Sandwell Childrens Trust
Sefton Metropolitan Borough Council
Sheffield City Council
Shropshire Council
Solihull Metropolitan Borough Council
Somerset County Council
South Gloucestershire Council
South Tyneside Metropolitan Borough Council
Southampton City Council
Southend-on-sea Borough Council
St Helens Metropolitan Borough Council
Staffordshire County Council
Stockport Metropolitan Borough Council
Stockton Council
Stoke-on-Trent City Council
Suffolk County Council
Sunderland City Council
Sunderland Provider - Together for Children
Surrey County Council
Swindon Borough Council
Tameside Metropolitan Borough Council
Thurrock Council
Torbay Provider - Torbay and South Devon NHS
Trafford Metropolitan Borough Council
Wakefield Metropolitan Council
Walsall Metropolitan Borough Council
Warrington Council
Warwickshire County Council
West Berkshire Council
West Sussex County Council
Wigan Metropolitan Borough Council
Wiltshire Council
Wirral Provider - Cheshire and Wirral NHS FT
Wokingham Borough Council
Worcestershire Children's First (Part of Worcestershire Council)
Worcestershire County Council
Acknowledgements
The authors especially acknowledge the support of a range of organisations:
- The Association of Directors of Adult Social Services (ADASS)
- The Association of Directors of Children’s Services (ADCS)
- British Association of Social workers (BASW)
- The Department of Education (DfE)
- The Department of Health (DHSC)
- Health Education England (HEE)
- Joint University Council Social Work Education Committee (JucSWEC)
- Local Government Association (LGA)
- National Society for the Prevention of Cruelty to Children (NSPCC)
- Social Care Institute for Excellence (SCIE)
- Skills for Care (SfC)
- Social Work England
- UNISON the Public Service Union
- The Adult and Children’s Principal Social Worker Network
- Royal College of Occupational Therapists (RCOT)
- The Principal and Strategic Lead Occupational Therapists National Network